Spectrum-2D Widget
A widget that allows plotting multiple spectrum attributes on the y-axis against a single spectrum attribute on the x-axis.
Widget setting
The widget allows for multiple spectrum attributes to be specified in a one-to-many configuration; one for the x-axis and many for the y-axis, respectively.
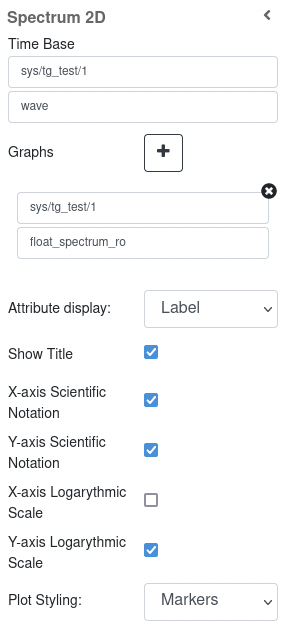
The Time Base is a spectrum attribute for the x-axis of the oscilloscope. Since the widget supports multiple y-axis spectrum attributes to be added, pressing the “+” sign next to Graphs will enable the user to specify a spectrum attribute.
Other settings include:
the option of displaying the
LabelorNameof the attributes being plotted,the checkbox for whether or not the title of the plot should be visible (this
Show Titleoption affects the padding of the plot),two checkboxes, one for X- and one for Y-axis, indicating whether the scientific (exponential) notation format should be applied to any axis,
two checkboxes, one for X- and one for Y-axis, indicating whether logarithmic scale should be applied on any axis,
the option of adjusting the style of plot indicators, possible choices are:
Linear,Bar Chart,Markers,Linear with markers.
The y-axis contains four spectrum attributes representing four dictinct channels and their waveform voltages from an ossiloscope plotted against another spectrum attribute called time-range
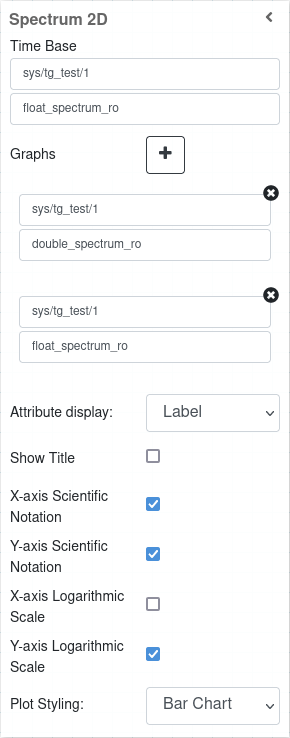
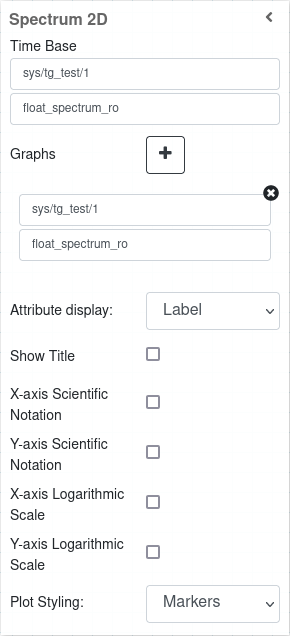
The y-axis, plotted against spectrum attribute called `float_spectrum_ro`, contains:
two spectrum attributes `float_spectrum_ro` and `double_spectrum_ro` drawn on a Bar Chart plot with scientific notation format and logarithmic scale on y-axis (left),
one spcetrum attribute `float_spectrum_ro` drawn on a Marker plot (right).
Widget design
The plot is rendered using plotly, a robust and interactive graphing library. The plots are re-drawn as they are updated by spectrum attribute data pushed by the respective tango device that the attributes associate with. PLotly, natively provides a couple of tools to interact with the plots. These include, zooming, panning, focusing on specific graph parts, resetting axes and saving snapshots of the graph as Portable Network Graphics(PNG) files.
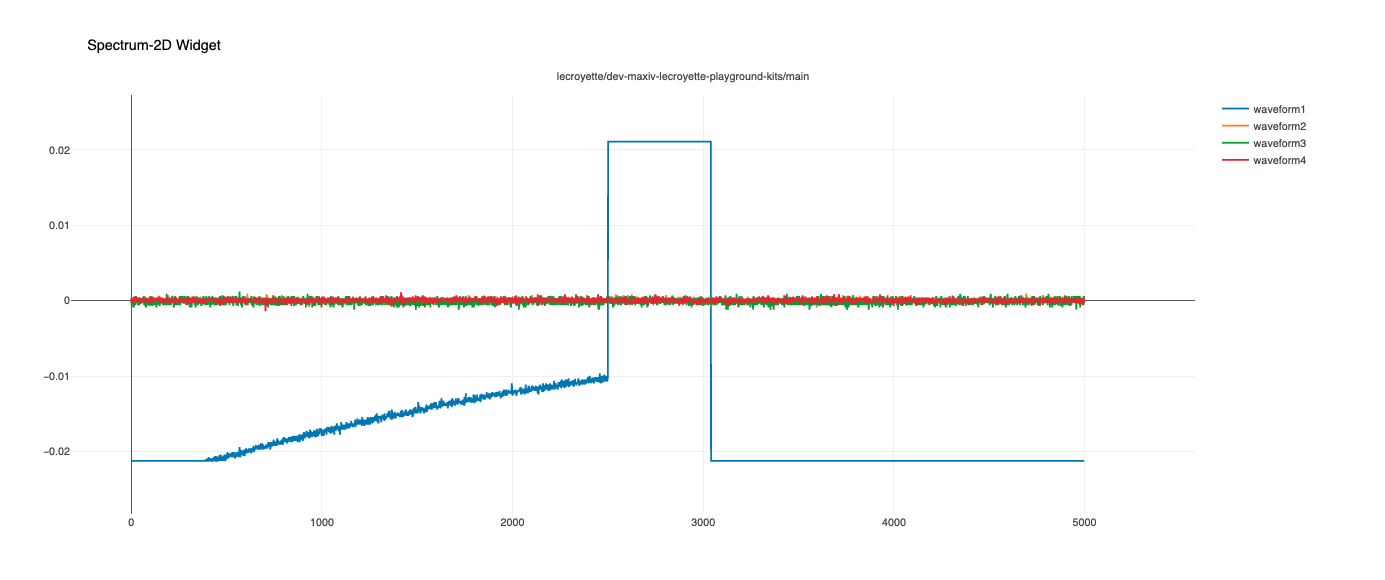
The plot shown above is a sample of a four channel oscilloscope plotted against (psuedo)time-range
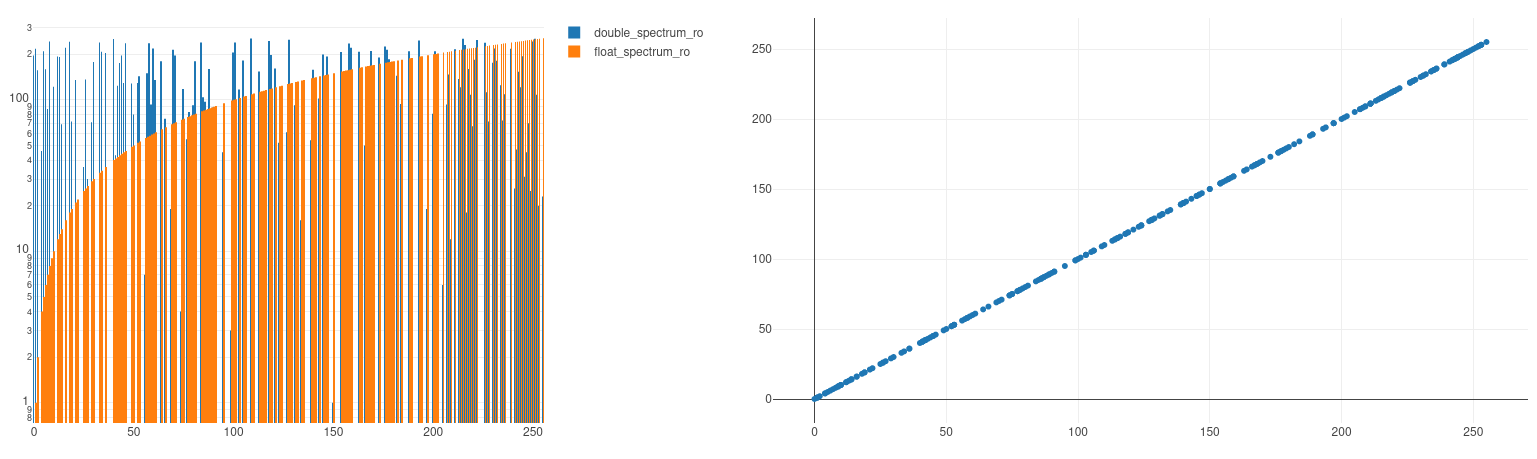
The plots above, plotted against `float_spectrum_ro`, shows:
spectrum attributes `float_spectrum_ro` with `double_spectrum_ro` drawn on a Bar Chart plot with scientific notation format and logarithmic scale on y-axis (left),
spectrum attributes `float_spectrum_ro` drawn on a Marker plot with linear scale on both axes (right)