What is Taranta
Taranta (Webjive until v 1.1.5) is a web application that allows a user to create a graphical user interface to interact with Tango devices; the interface may include a variety of charts, numerical indicators, dials, commands that can be used to monitor and to control devices.
Strengths
The strengths of Taranta are that:
It allows you to easily browse devices of a Tango server, inspect them and interact with them, all using your web browser of choice.
Secondly it allows you to quickly develop and change interactive dashboards with widgets that allow you to monitor and interact with Tango devices. Once created, dashboards can be run, saved, and exported.
A dashboard can be defined in a few minutes, with minimal knowledge of web technologies; you only need to know which devices you want to interact with and what attributes and commands they expose.
Usage scenarios
Taranta is meant to be used in two main scenarios:
As a tool for building dashboards that support an engineer in monitoring and debugging a device that the engineer is working on. In this scenario the dashboard designer is expected to quickly produce a new dashboard, quickly change it to suite current needs, and perhaps after a few days or weeks, the dashboard is discared. This is the scenario that is currently active in many SKA teams, where engineers use dashboards to debug their devices and to demo their behaviour.
As a tool for building long-lived dashboards. They are carefully crafted by dashboard designers and are used by other people to monitor and interact with devices. This is a scenario that is currently active in MaxIV.
Examples of dashboards
This is a gallery of some of the dashboards that have been built with Taranta.
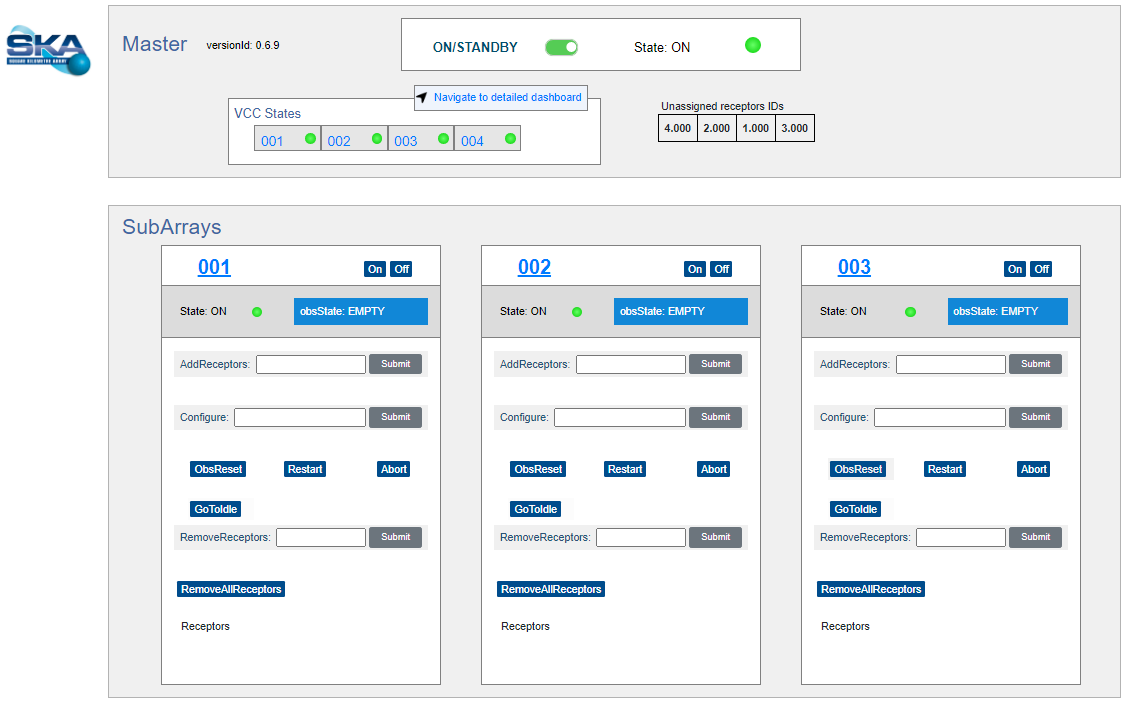
Example of a dashboard used in SKA for controlling 3 subarrays inside the Correlator. With the dashboard the user can turn on/off the device, assign or remove receptors to/from each of the subarray, send a configuration to each subarray, change the state of the subarray. The dashboard features also a link to another dashboard.
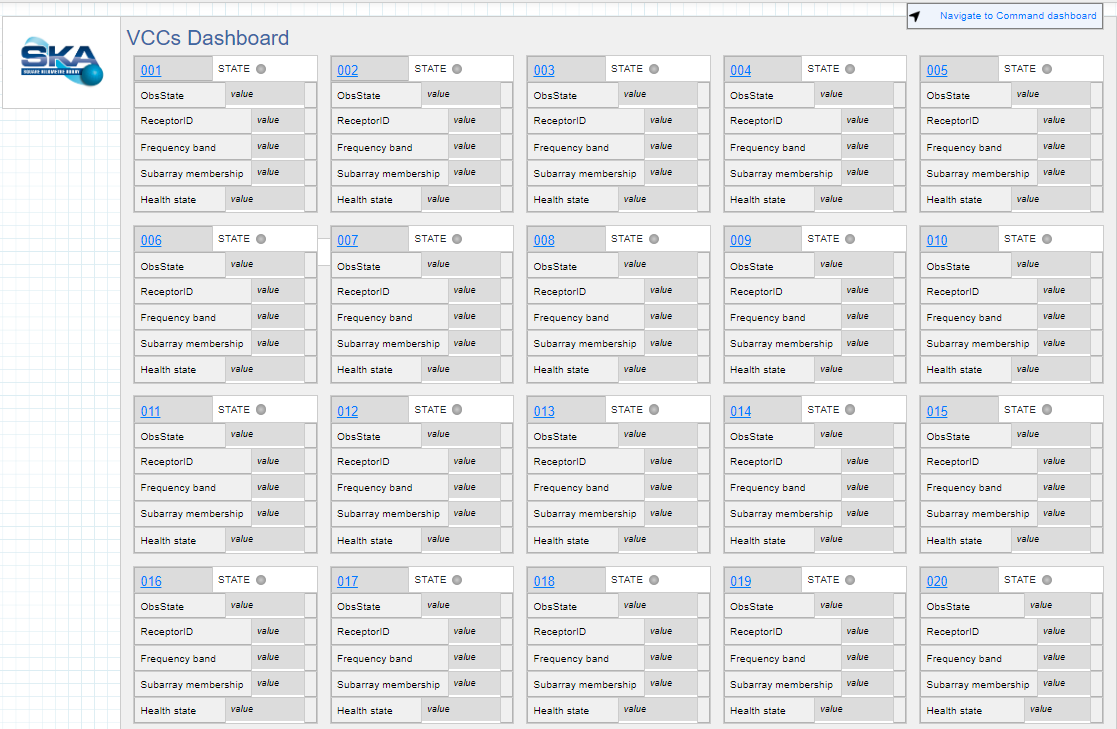
Example of a dashboard used in SKA for monitoring 20 VCCs, which are devices of the Correlator. The state and attributes of each VCC are updated several times per second; in this way an engineer can observe the behavior of these devices when operating on the Correlator subarrays (see previous figure).
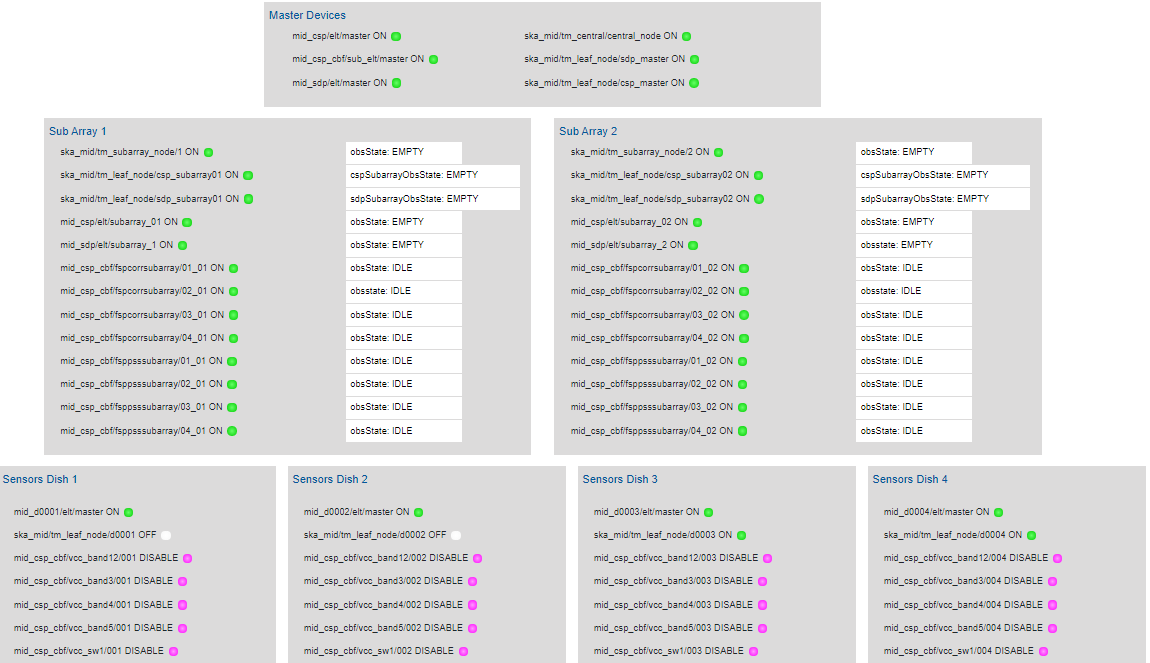
Example of a dashboard used in SKA for monitoring a hierarchy of devices (Master, Subarrays, Sensors). An engineer uses it to monitor how commands percolate through the hierarchy.
As an example, to create this dashboards the engineer spent about 2 hours.