How to use Taranta
How to handle users
Todo
complete the description of the following things
how to configure them
how to enable/disable them
where to do that
how authentication is handled
*Note: A token is created on successfull login of user which is valid for 1 hour. On expiry of this token You are logged out, please login to continue using dashboard. info message is shown to user and login link is visible in header section
How to use multiple databases
Multiple Tango databases can be accessed via Taranta. To make them available, a list of databases should be provided under the TANGO_DATABASES key in the config.json file. This setup will redirect the API calls to the appropriate backend. Please note that you should ensure that a backend service is available for the Tango databases provided. This can also be achieved (e.g., in a development environment) by modifying the setupProxy.js file, where proxies for db and socket should be set.
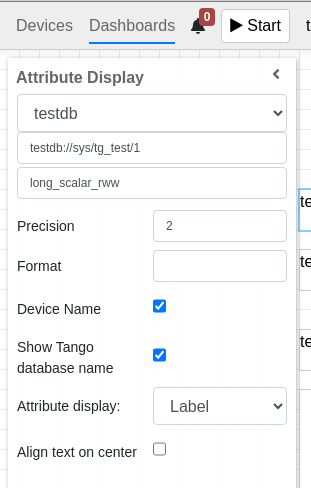
Once the databases are configured, an additional input will appear inside the Attribute Selector, allowing the selection of a Tango database. Subsequently, a device list will be loaded.
How to use Devices
Todo
complete the description of the following things
how to change Tango server
the “Overview” section
how to search Devices
how to search for attributes and commands
how to monitor attributes and states
how to send commands and change attributes
How to use Dashboards
Creating a dashboard
Todo
complete the description of the following things
managing dashboards in the list of dashboards
addign widgets
say about the grid
say about layers
Using layers to create backgrounds
Todo
Explain how to use layers to develop rich dashboard
Sharing dashboards
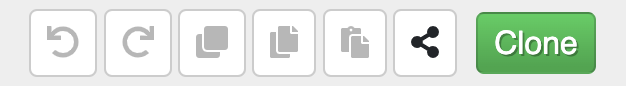
Dashboards can be shared among groups. To share a dashboard, the user must be logged in and click on the “Share” icon in the top menu.
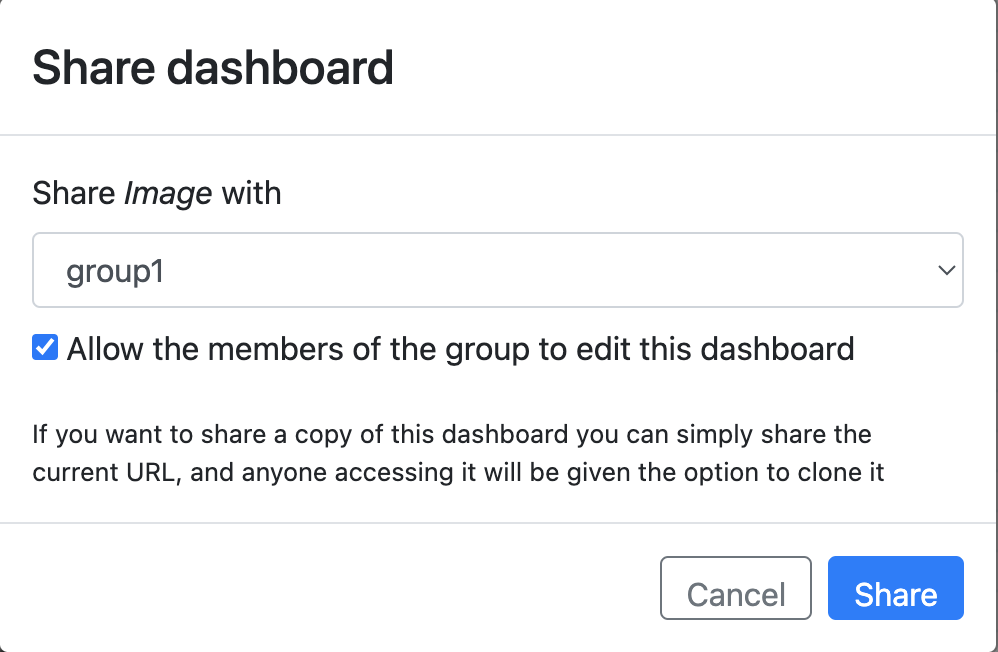
Once clicked, a popup will appear, as shown in the image, where the user can select which group to share the dashboard with, based on the list of groups associated with their account. Additionally, the user can choose whether the shared dashboard can be edited by group members or is only available for viewing.
When a dashboard is shared, the “Share” icon will turn green. If you wish to stop sharing, click the “Share” button again and select “No one” as the group. At this point, a message will appear confirming that the dashboard is no longer shared, and the icon color will return to black.
Users belonging to the same group as the shared dashboard will find it in the Dashboard Tab in the right pane, at the bottom labeled “Shared Dashboard,” where all shared dashboards are grouped by their respective groups.
Shared dashboards without editing privileges are not editable. However, users can still explore the configuration of individual widgets in the inspector and the Layer tab, but interaction is not possible since it is restricted.
Exporting and importing dashboards
Parametric Dashboard
Sharing Dashboard using environment field
Monitoring Taranta
How to use Synoptics
A synoptic is a controllable schematic representation of a control system, offering users a flexible and intuitive overview of its operations.
Taranta Synoptics view supports Scalable Vector Graphics (SVG)-based synoptics.
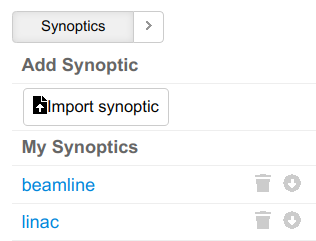
Similar to the Dashboards, a synoptic.svg file can be uploaded to Taranta using the Import synoptic button. The imported synoptics will be
displayed under My Synoptics with the corresponding file name. Users can manage the uploaded synoptics via the right-side panel, where they
have the options to delete, export, or share them with other users.
An example of Linac synoptic and the management panel is shown below:
How to create a synoptic svg file can be found in Creating SVG file using Inkscape.
Control Synoptics
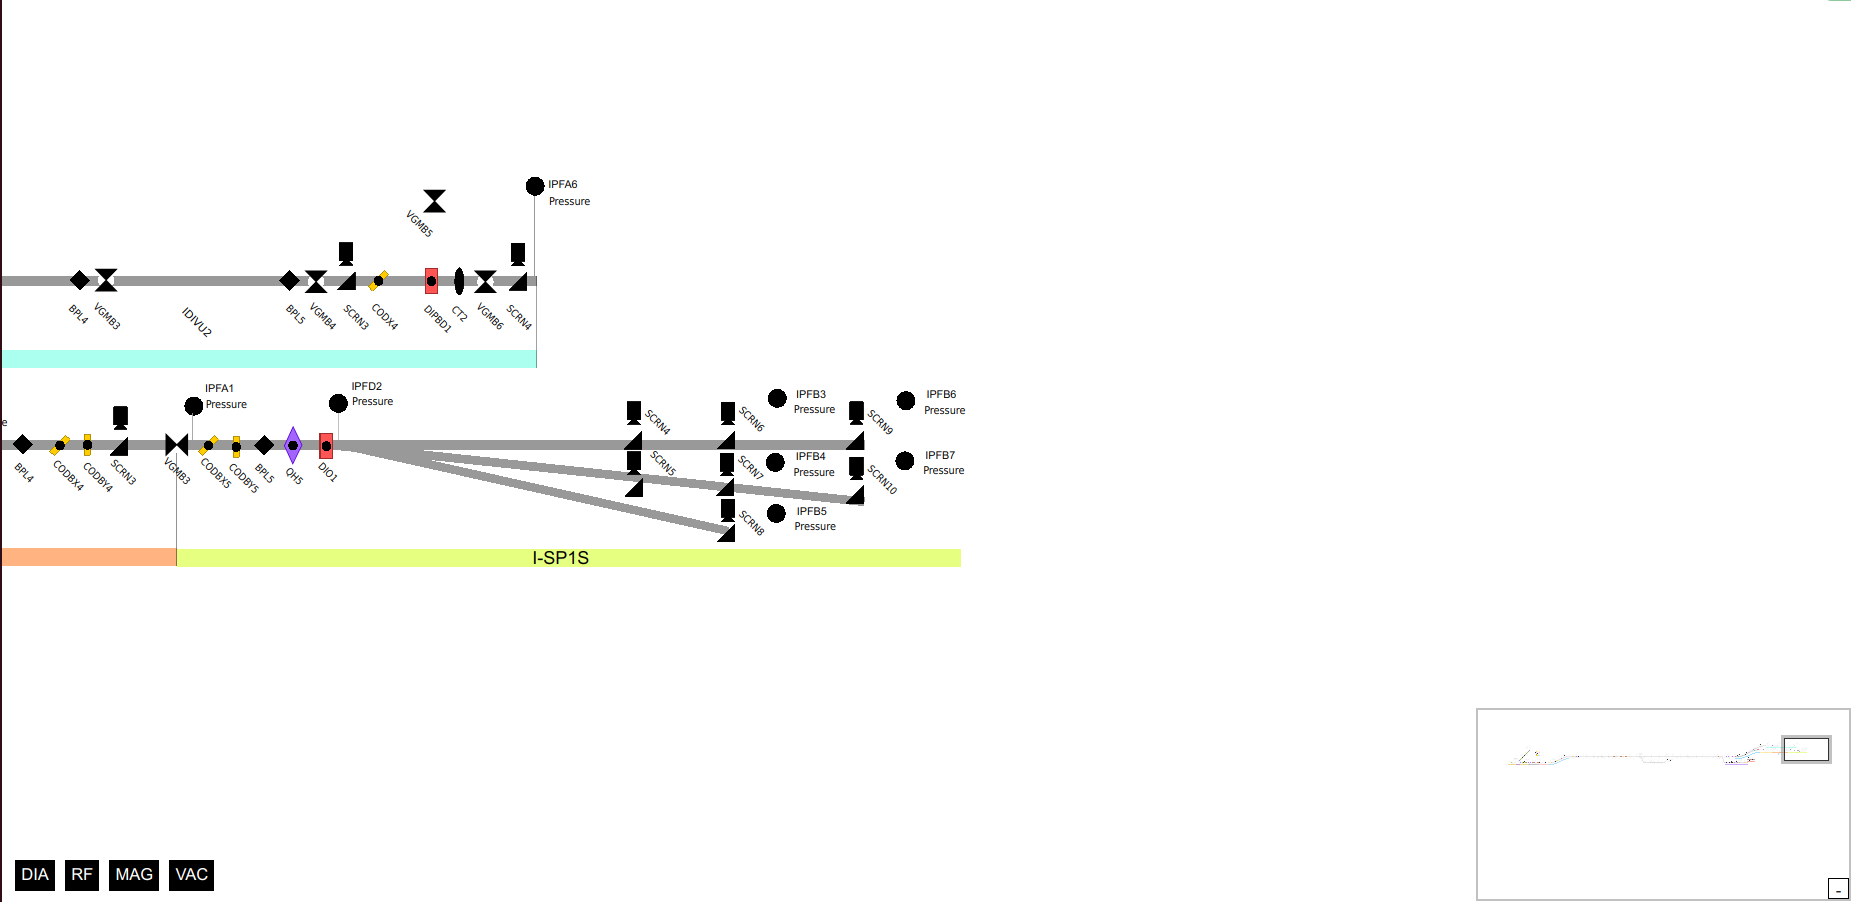
The synoptic viewing supports pan and zoom features. Zooming updates the visible layers and hides unnecessary elements from the current view.
Hovering over each SVG element displays a clickable tooltip linked to the corresponding Tango device, redirecting you to the relevant
device in the Device tree. In addtion, a thumbnail is provided in the bottom right corner to assist controlling the viwe. This thumbnail appears
after selecting a synoptic and can be hidden via the corner toggle. A frame within the thumbnail indicates the currently visible area.
Clicking on a desired spot within the thumbnail updates the synoptic view and moves the indicator frame accordingly.
An example of thumbnail indication for part of the Linac is shown as follows:
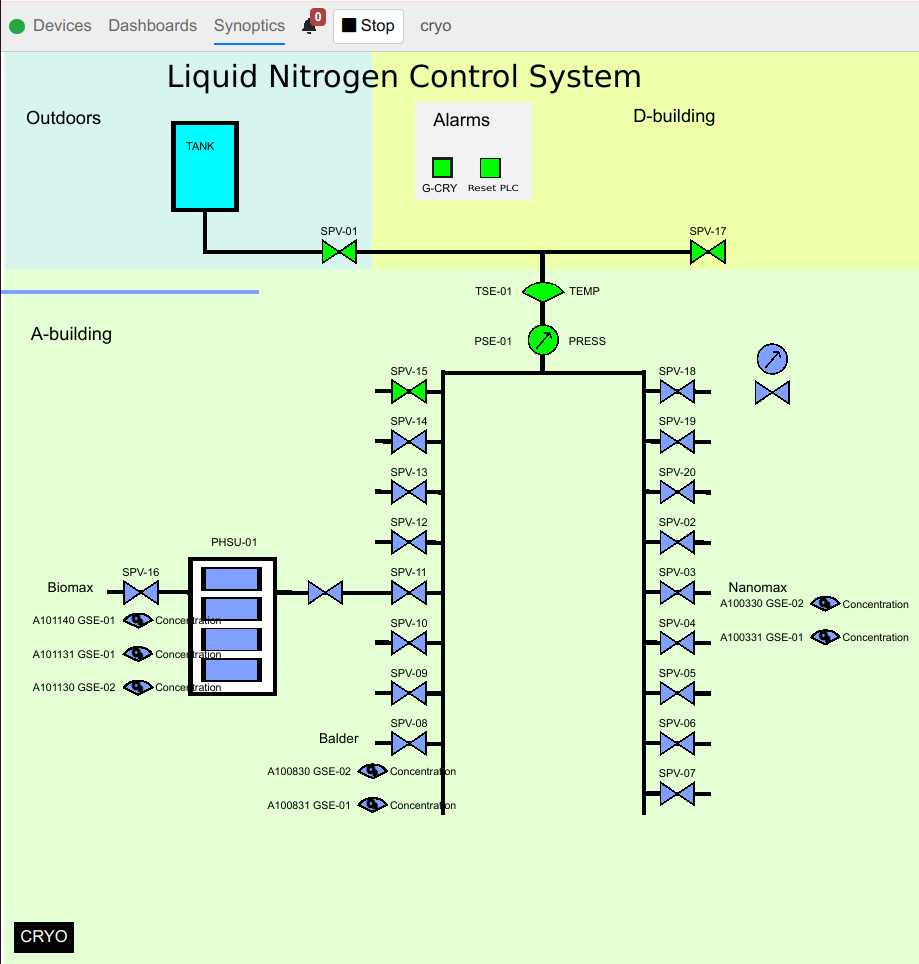
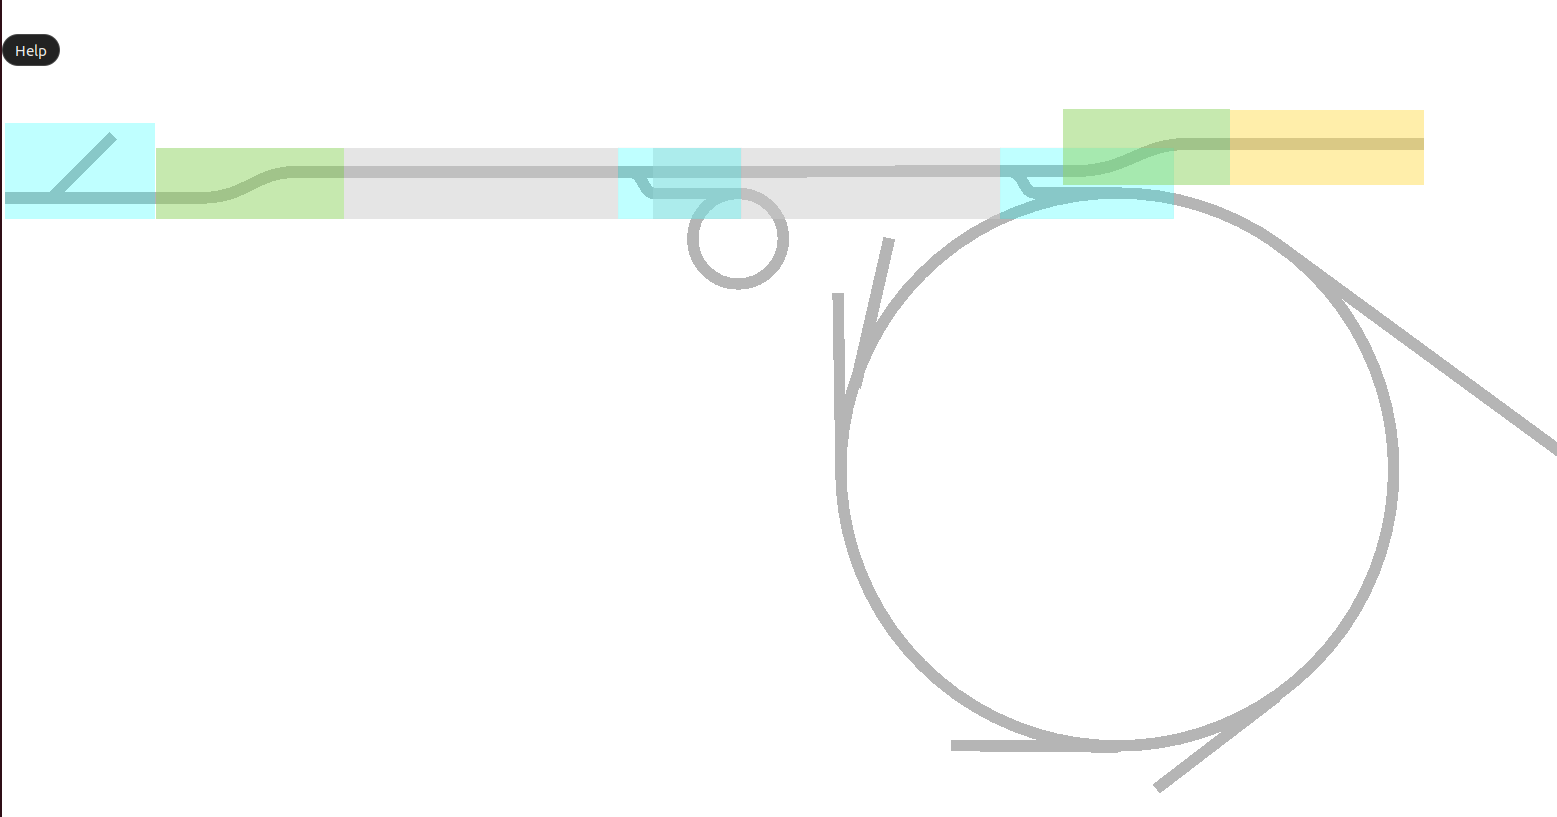
Run Synoptics
Animating a synoptic at runtime is the same as running a dashboard. By clicking the Start button, the communication between the synoptics and the connected tango devices is established. In an active synoptic, components can display different colors based on the device’s state or the attribute value, particularly if the attribute is of boolean type. A running synoptic of the liquid Nitrogen control system is shown as follows, where blue color indicates the corresponding tango device is in the RUNNING state and green signifies the ON state.