Debugging Taranta in the browser
Debugging is the process of finding and fixing errors within a script.
All modern browsers and most other environments support debugging tools – a special UI in developer tools that makes debugging much easier.
It also allows to trace the code step by step to see what exactly is going on.
The “Console” panel
Your Chrome version may look a little bit different, but it still should be obvious what’s there.
Open Taranta page in Chrome.
Turn on developer tools with F12 (Mac: Cmd+Opt+I).
Select the “Console” panel.
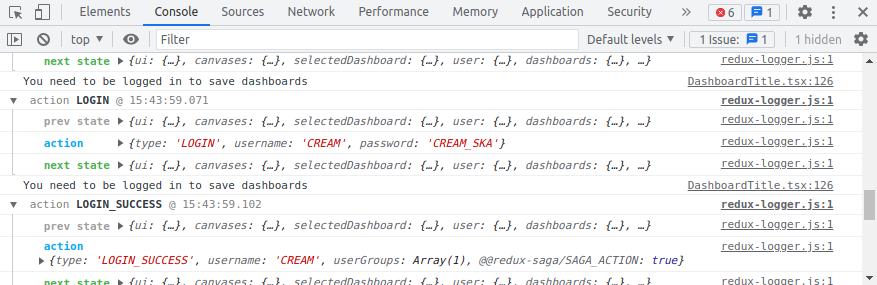
Here’s what you should see:
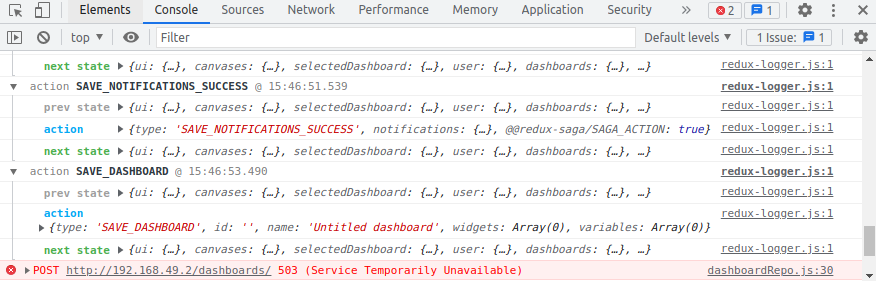
If you are facing some issue, for example here we have stopped the dashboard pod and tried to create a
new dashboard, in this way taranta will throw an error 503 (Service Temporarily Unavailable)
Opening console we can confirm this: