Taranta Elasticsearch log viewer
Taranta has a new widget called Elasticsearch Log Viewer
Has it stands it makes use of Elastic search on the STFC
Elastic query URL example -> https://k8s.stfc.skao.int/taranta-namespace/_search
Kibana UI -> https://k8s.stfc.skao.int/kibana/
Connection with STFC:
To connect to the STFC elastic server, taranta uses the direct access IP: http://192.168.99.131:9200, through a service on your namespace for example https://k8s.stfc.skao.int/taranta-namespace/_search
If you are using taranta locally on minikube make sure you are connected to the STFC VPN otherwise you won’t have access to elastic API and it’s results
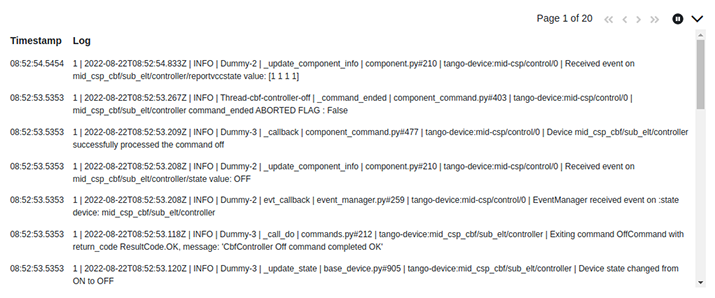
The Elastic search Widget:
The elastic search widget uses the elastic search service to query log stored on the STFC.
This widget has a couple of filters that can be applied in order to filter the logs displayed on the widget
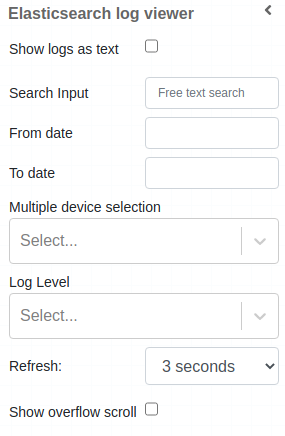
Elastic widget all available filters:
Filter |
Description |
|---|---|
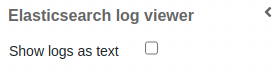
Show log as text |
Switches message fields display between table or text |
Search input |
Allows text introduction to filter message field |
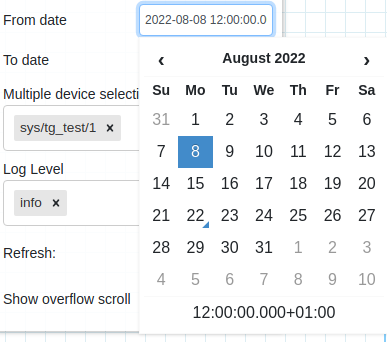
From date |
Date/Time introduction to filter FROM message timestamp field |
To date |
Date/Time introduction to filter TO message timestamp field |
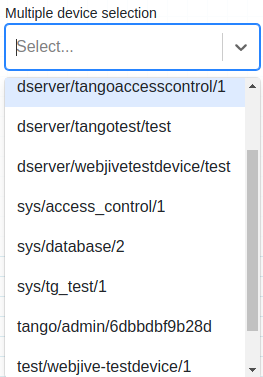
Multiple Device |
Allows multiple device dropdown selection |
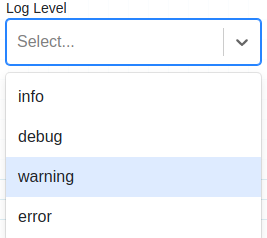
Log level |
Allows log level dropdown selection |
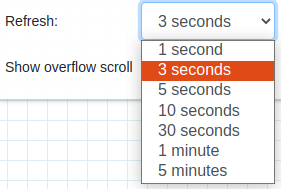
Refresh |
Sets the refresh time to query elasticsearch |
Show overflow scroll |
Forces scroll on the widget box |
Elastic widget device selection filter:
Elastic widget log level selection filter:
Elastic widget refresh time filter:
Elastic date/time selection filter:
Elastic widget type (table or text) of display selection:
Widget RunCanvas
RunCanvas live filters available:
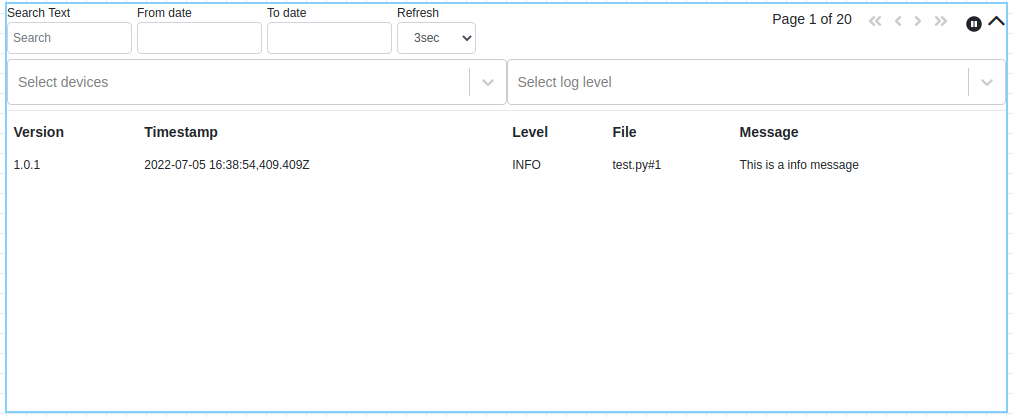
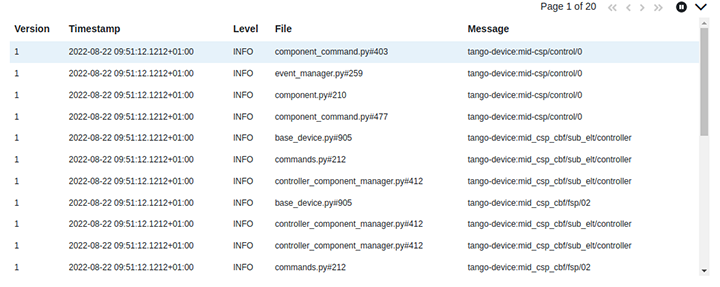
Elastic widget fields as columns:
Elastic widget fields as text: