Observation Page
On entering the observation page for the first time, it will look like Figure 14. To add Observation(s), click the  button (see Add Observation section).
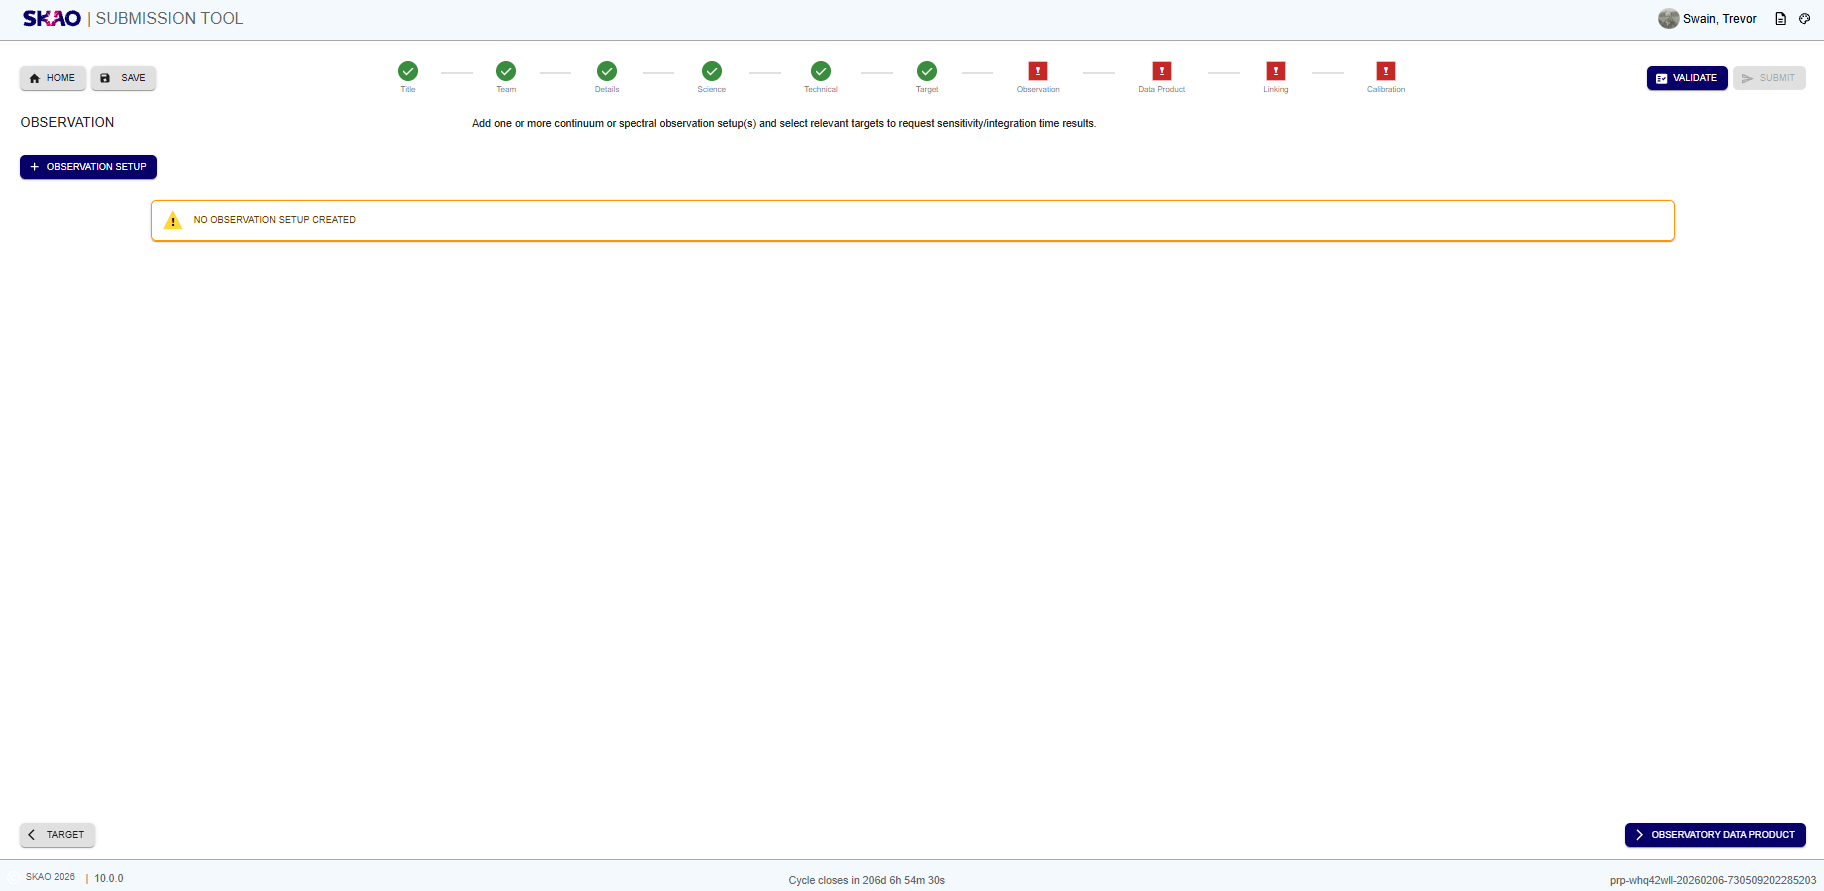
Figure 39 : Image of the Observation page.
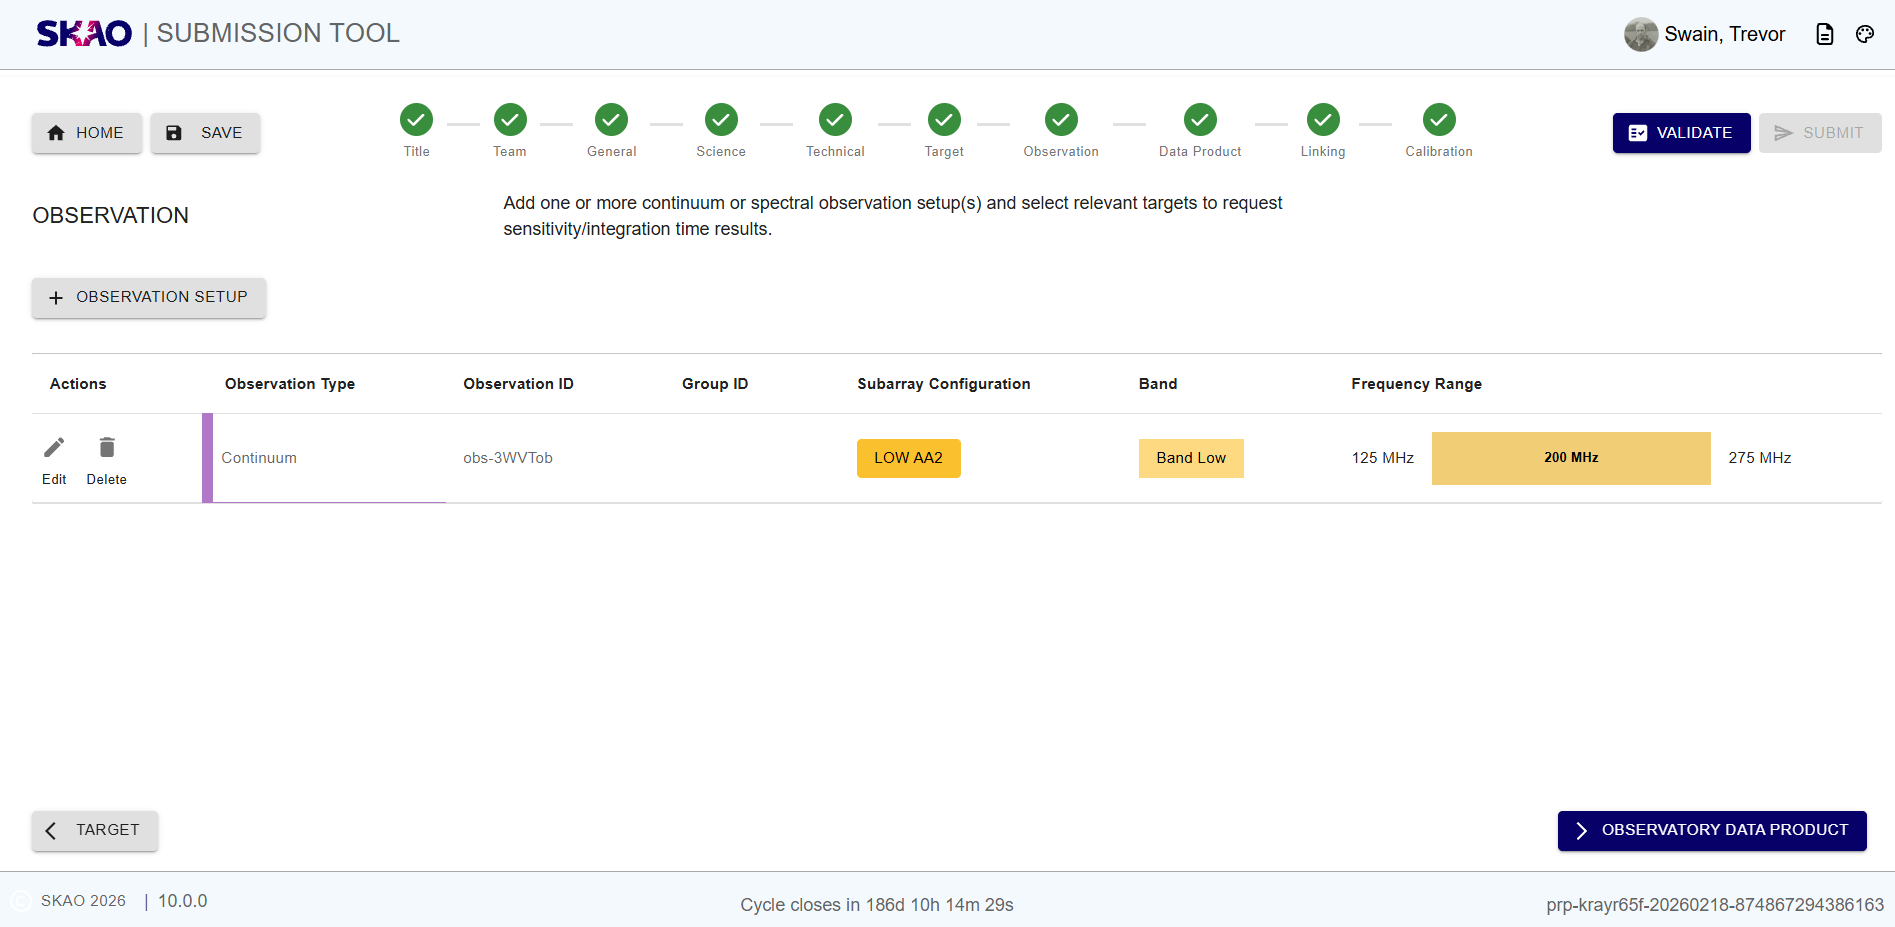
Figure 40 : Observation page with Observation(s) added.
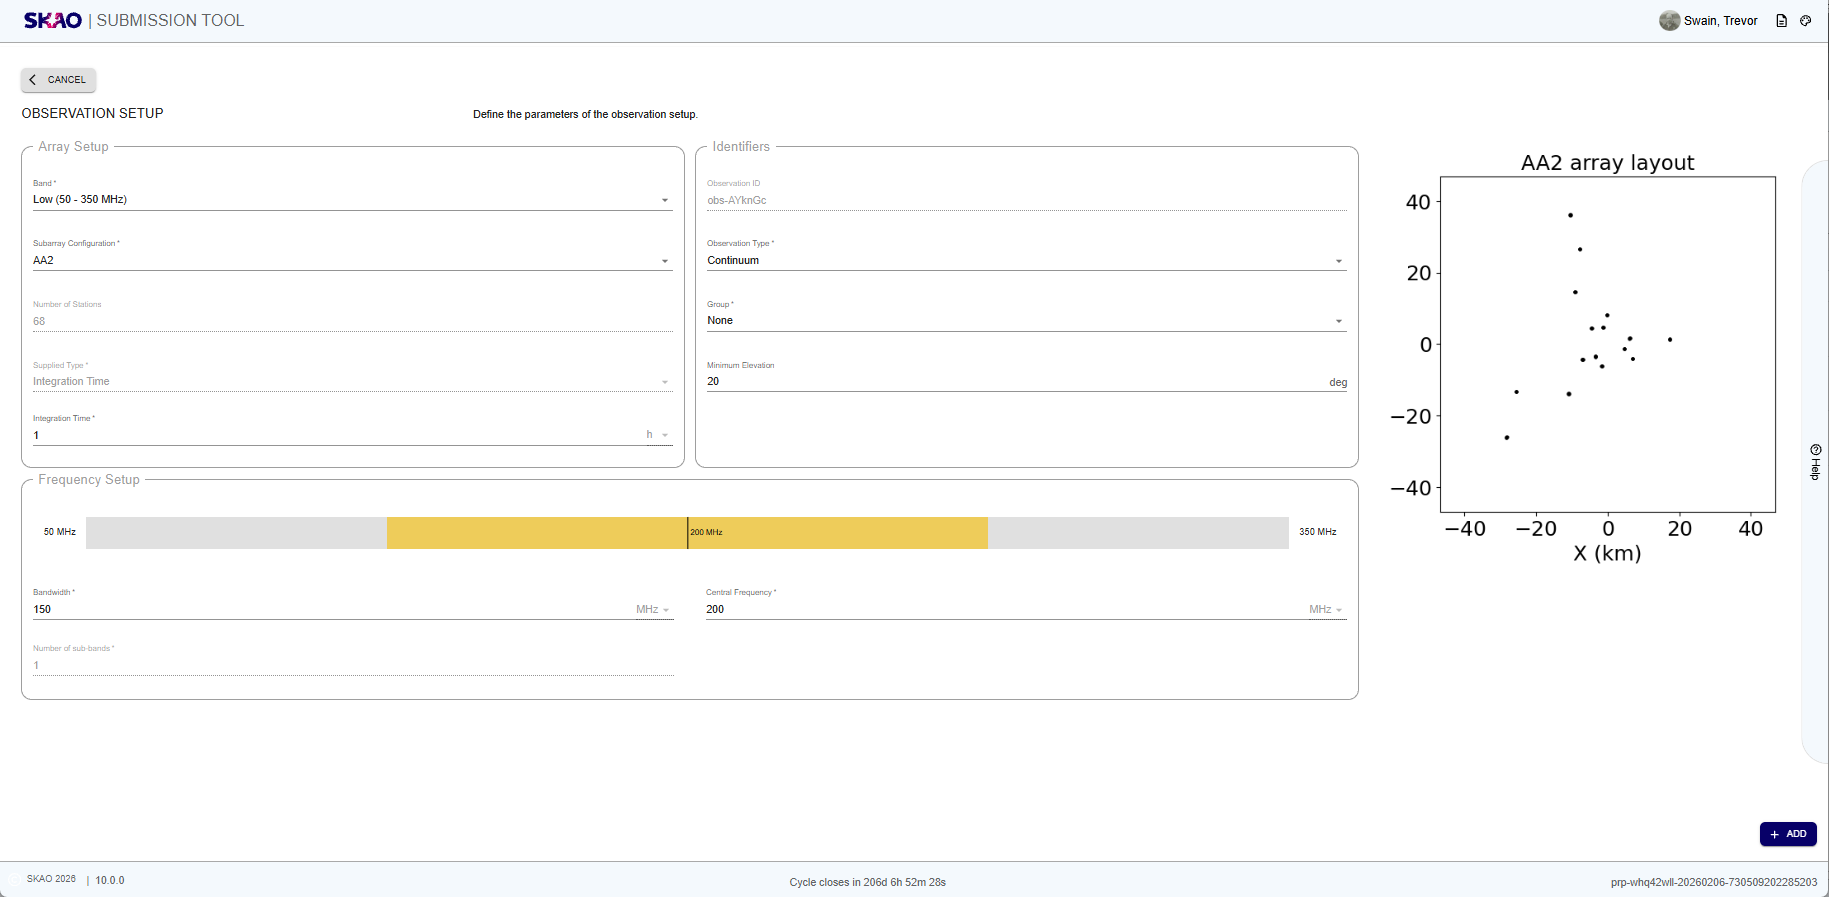
Figure 41 : Observation page to edit an observation.
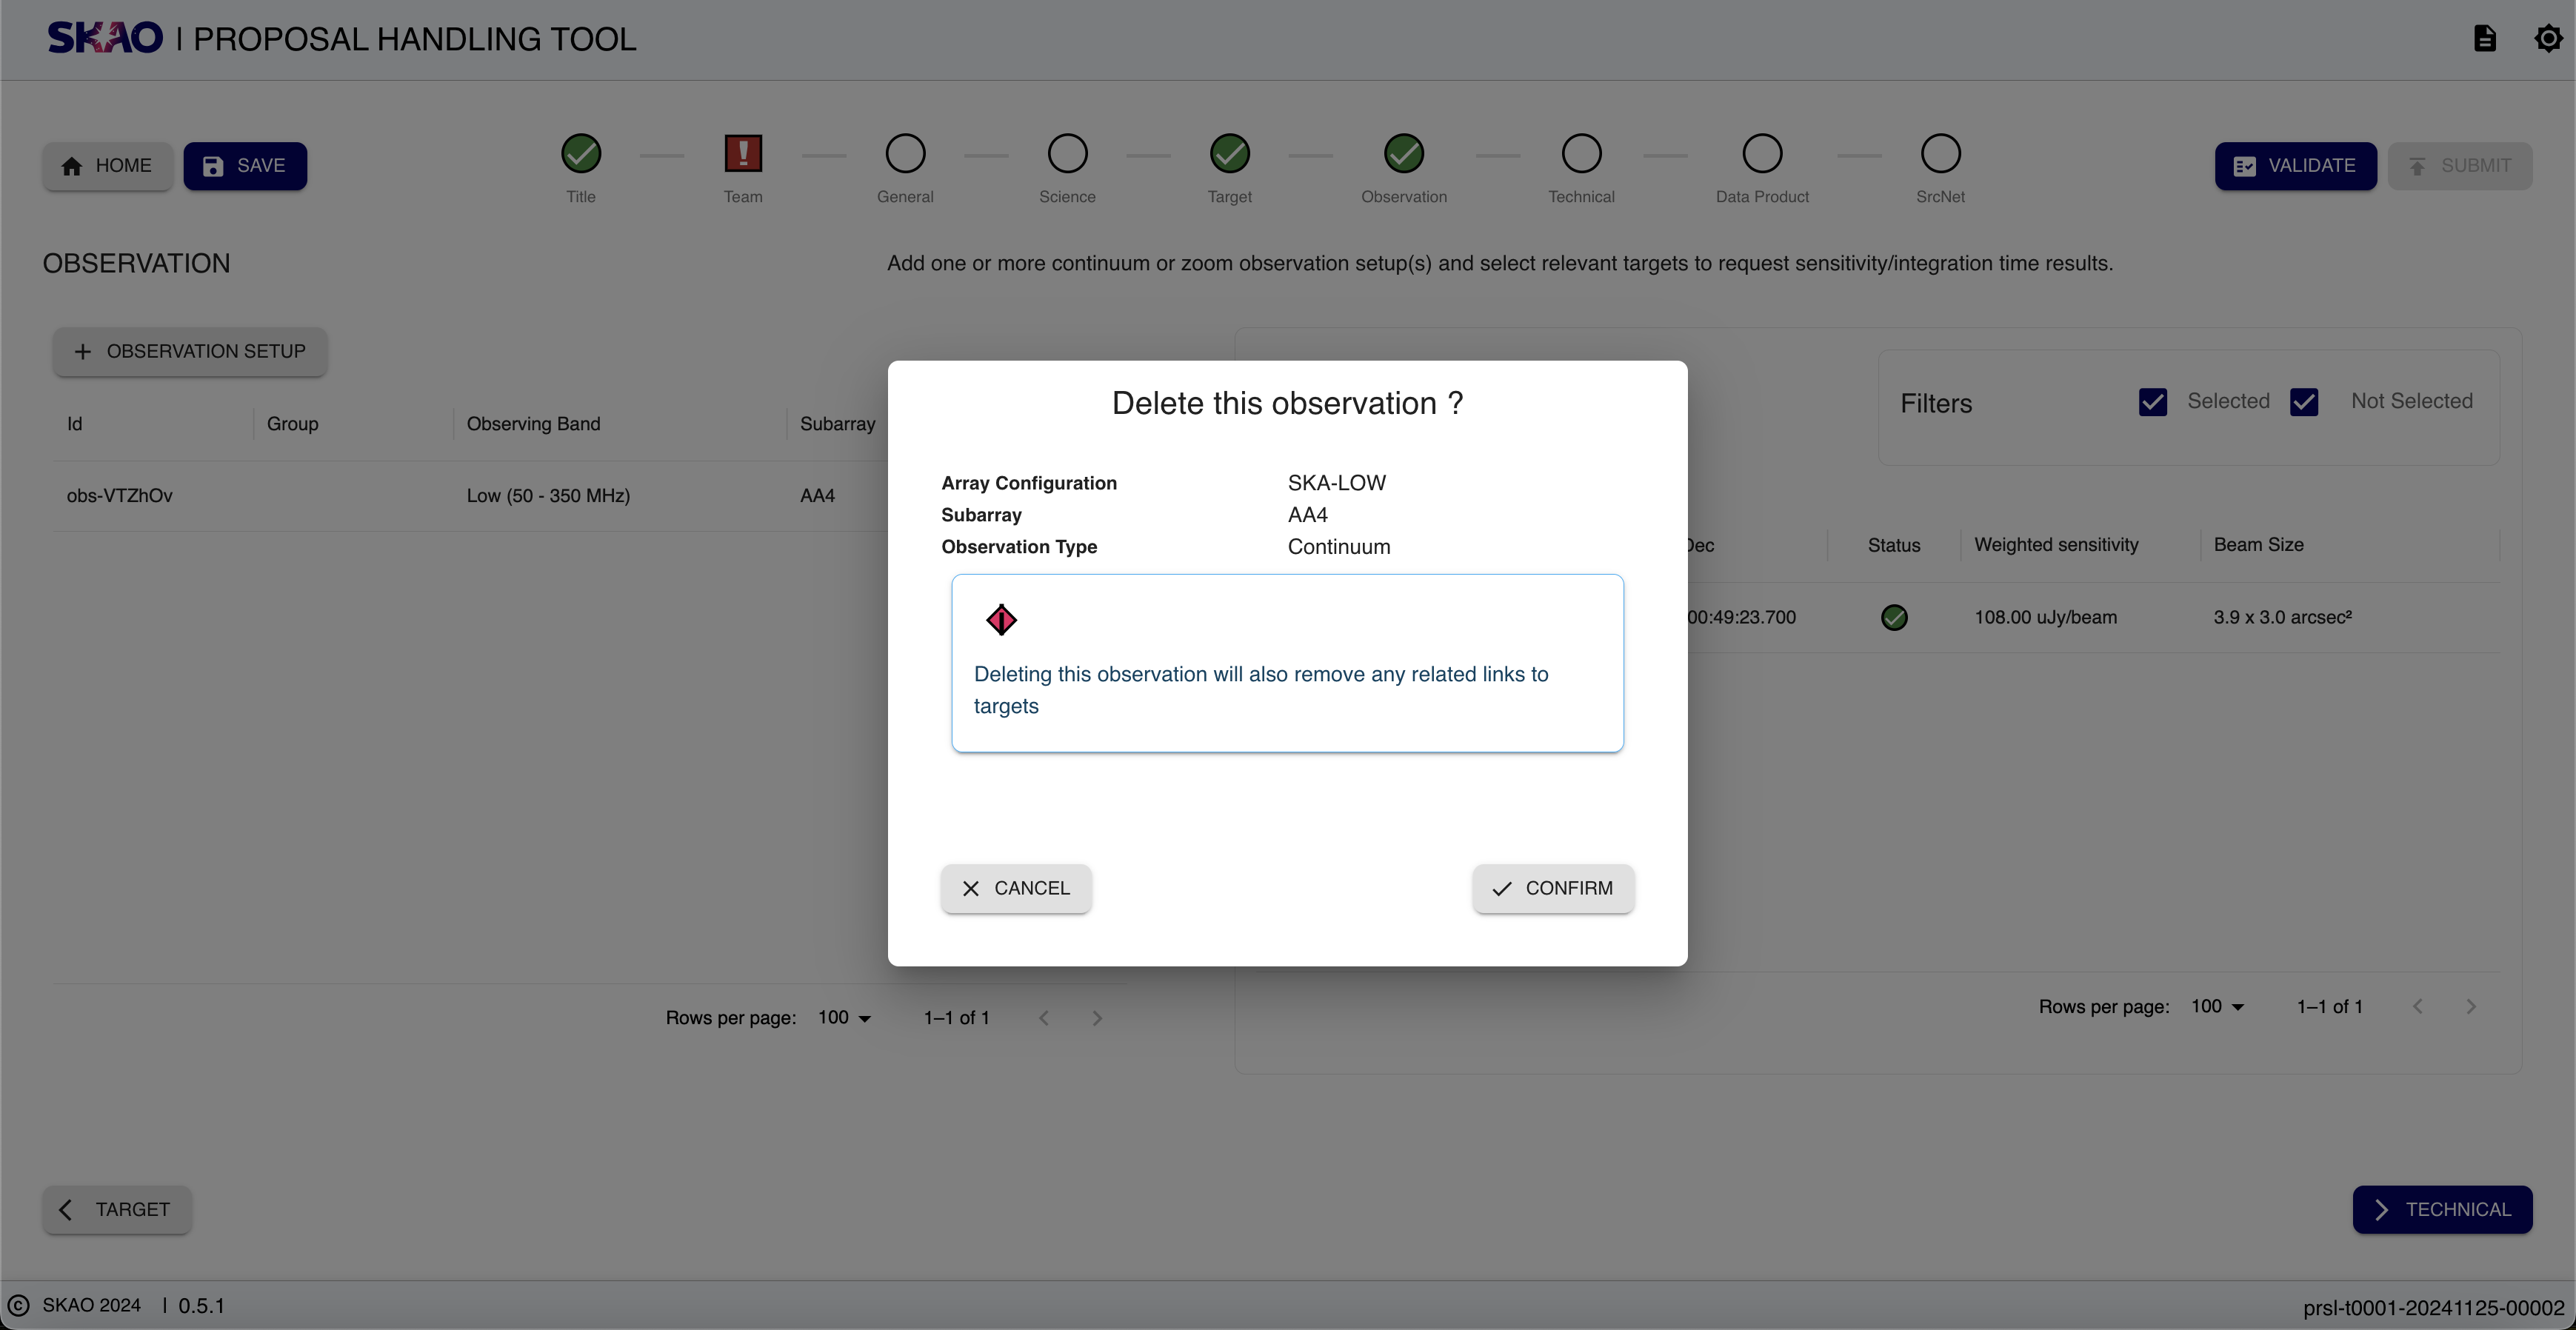
Figure 42 : Modal to delete an observation.
Layout and Navigation
The Observation Page consists of the Observation set table, which displays the following details :
Actions :
icon allows an observation to be edited as shown in Figure 41. This is identical to the ‘Add Observation’ page but the difference is ‘Update’ at the bottom of the page instead of ‘Add’. Upon completion of this action, any affected Sensitivity Calculation results will be replaced, so it is encouraged to check that the results are still appropriate.
icon provides the ability to delete ( after confirmation ) the selected observation. Once clicked, a summary of the selected observation is displayed as seen in Figure 42. Upon confirmation, the selected observation, together with all the links to targets and data products will be removed.
Type : Observation type i.e Continuum, Spectral or PST.
Id : Unique id for each observation set.
Group : Group name if a given observation belongs to a group.
Subarray : The selected sub-array of the observation.
Band : The observing band. The options are :
LOW band
MID band 1
MID band 2
MID band 5a
MID band 5b.
Frequency Range : Displays the frequency range of the observation, with the central frequency in the colored section.
Add observation
When the button is clicked, the “Add Observation” page as shown in Figure 43 comes up. After filling and adding this page, it will be added on the observation table.
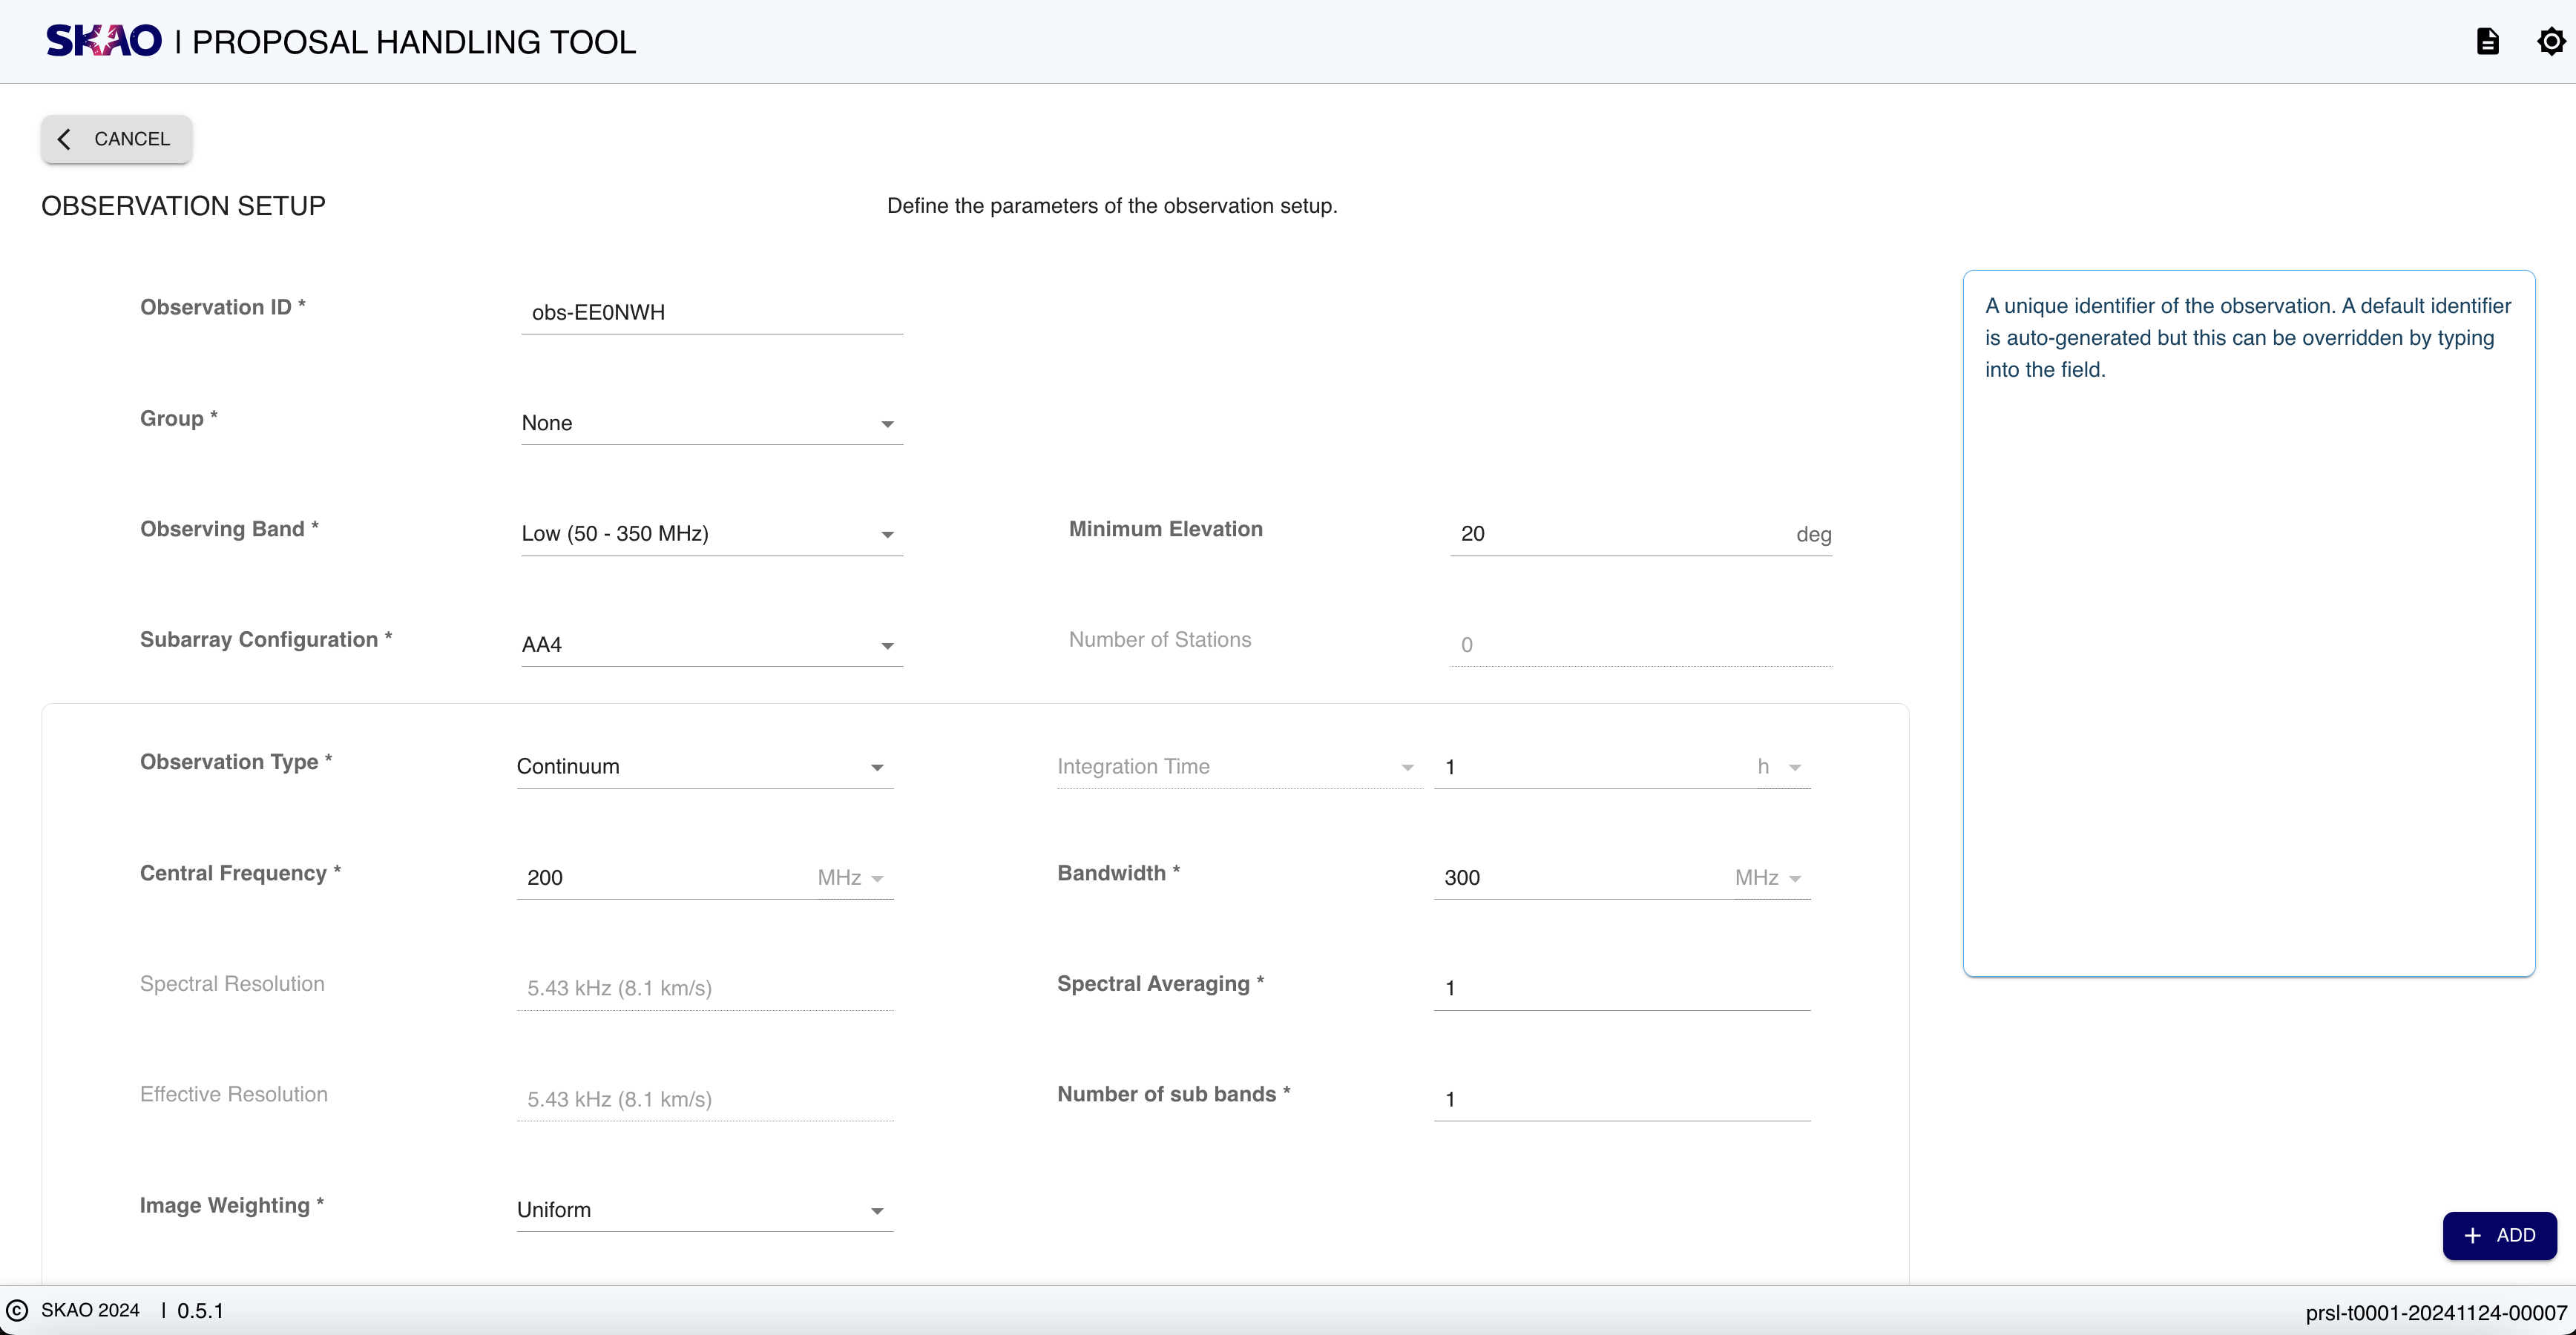
Figure 43 : The add observation page.
Key Information and Actions
The Observation Page allows you to:
Create new observation entries.
Group observations.
Manage observation list.
Have questions or need technical assistance? Contact SKAO Help desk ·