Monitoring & Logging Tutorial#
Learn to access monitoring dashboards, logs, and debugging tools for your deployments.
Pipeline links#
When you run a CI/CD pipeline, links to monitoring and logging resources appear in the GitLab job output. These links include your job’s metadata and time range.
Note
To enable these links in your project, integrate with the pipeline machinery.
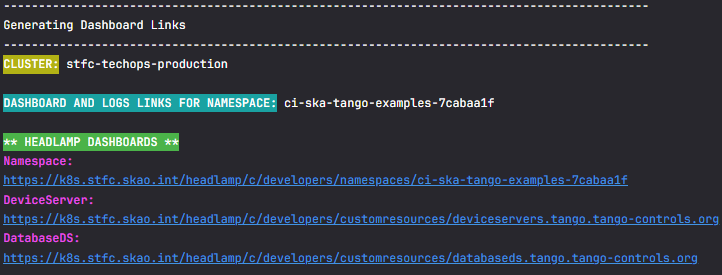
General links in GitLab pipeline output#
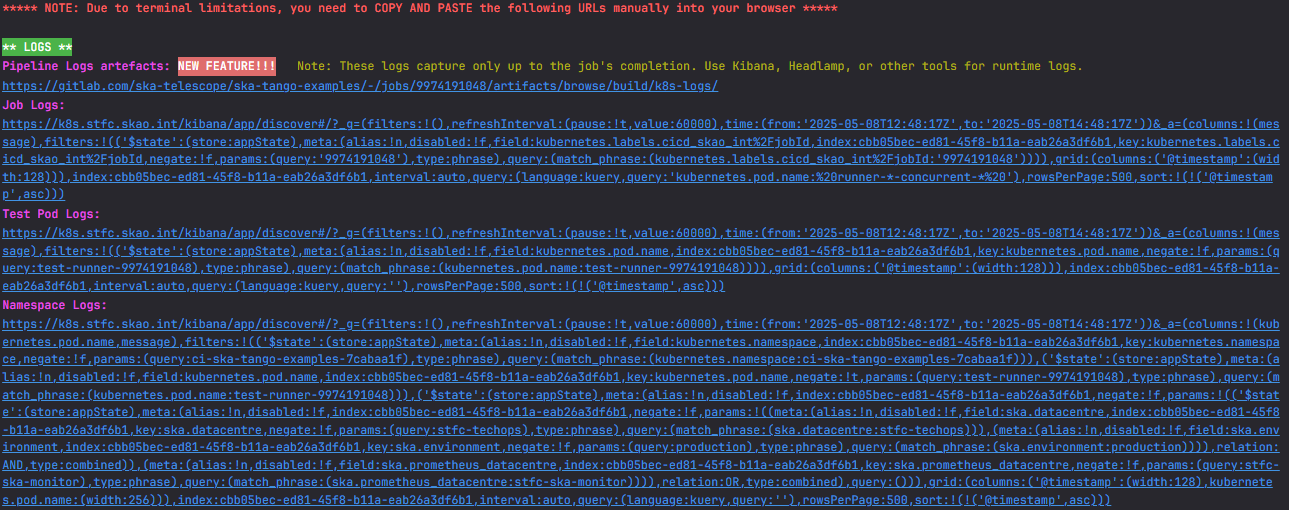
Log links in GitLab pipeline output#
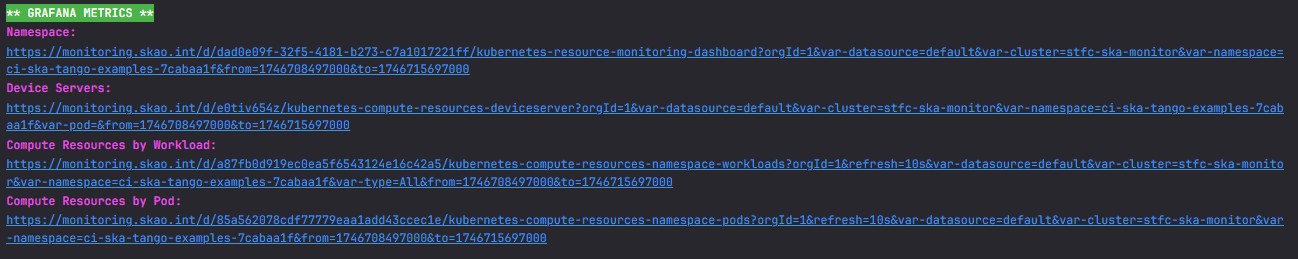
Monitoring links in GitLab pipeline output#
These links include:
Headlamp URL for the namespace
Pipeline log files for all namespace pods and pod descriptions
Kibana links for namespace logs, test pods, and Device Server configuration
Grafana links for namespace metrics, Device Servers, and compute dashboards
Tip
Copy and paste Kibana URLs into the browser — clicking them may not work due to URL length.
Merge request links#
The same links appear in your merge requests, organised by job with deployment type, namespace, and target cluster.
Monitoring links in merge requests#
Access Kibana for logs#
Go to Kibana
Click Continue as Guest for read-only access
Navigate to Discover in the left pane
Select your time range and add filters for your namespace
For full access (creating API keys, saving searches), create an account via STS ticket.
Access Grafana for metrics#
Go to Grafana
Click Sign in with Azure AD
Use your JIRA credentials:
<jira-username>@<community.skao.int or assoc.skao.int>Browse existing dashboards or create your own

Browsing Grafana dashboards#
Useful dashboards#
CI/CD pipelines:
Namespace resources:
Workloads:
Usage analytics (Kibana):
Download pipeline artefacts#
Pipeline jobs include log artefacts you can download for offline analysis:
curl -L https://gitlab.com/ska-telescope/ska-ser-oci-daemon/-/jobs/9819118142/artifacts/download -o job.zip
mkdir -p artefacts && cd artefacts
unzip ../job.zip
ls -R
This downloads:
Kubernetes events — All events in the namespace
Pod descriptions — Output of
kubectl describefor every podPod logs — Logs from all pods
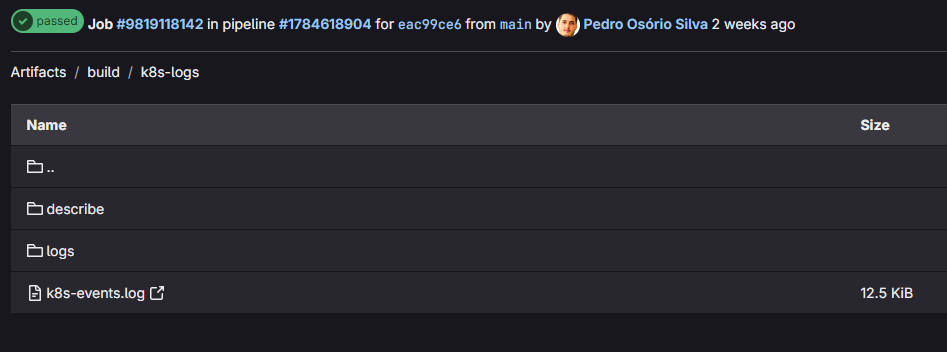
Pipeline job artefacts structure#
View deployment information#
Pipeline output shows deployed images and Helm charts:
***Gathering information for namespace: ci-ska-tango-examples-7cabaa1f***
OCI images for pod databaseds-tangodb-tango-databaseds-0:
    artefact.skao.int/ska-tango-images-tango-db:11.0.2

Installed Helm charts:
   test:
      Chart: ska-tango-examples-test-parent-0.1.16
      App Version: 0.1.16
   Dependencies:
      * ska-tango-base @ 0.4.16 | 0.4.18 Available!
      * ska-tango-util @ 0.4.16 | 0.4.18 Available!
The output shows installed versions and flags when newer versions are available.
This information also appears in Headlamp’s namespace view:
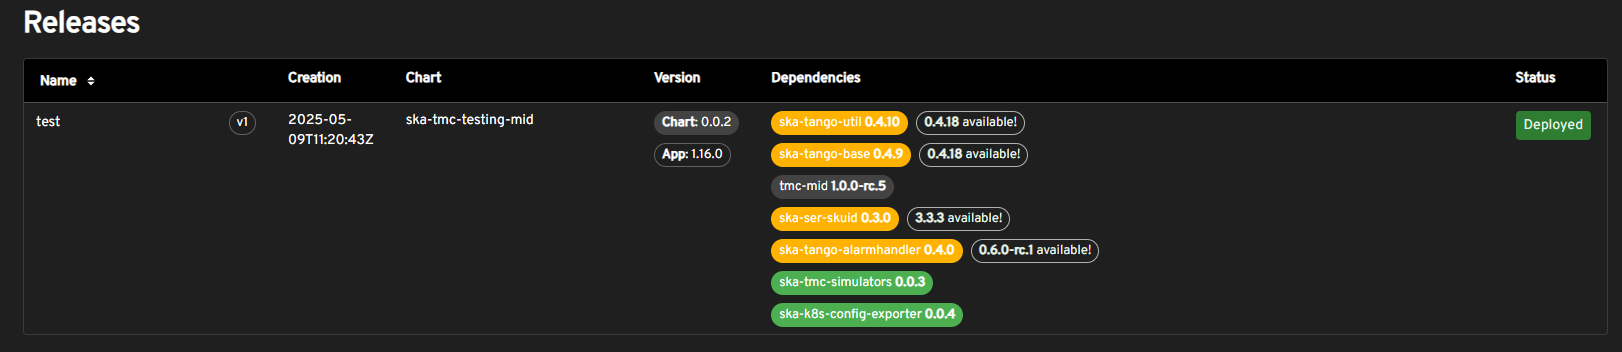
Helm release information in Headlamp#
Next steps#
Read Monitoring & Logging How-to Guides for detailed log filtering and Elasticsearch queries
Check Monitoring & Logging Reference for the SKA Log Message Format
Explore How It Works for Headlamp and Coder debugging tools