How It Works#
Understand the architecture and debugging tools available at SKAO.
Centralised architecture#
SKAO’s monitoring and logging solution aggregates data from all datacentres into a central system. This eliminates the need for multiple dashboards and provides:
Unified access — Single entry point for all environments
Data aggregation — Combine metrics and logs from multiple clusters
Zero-trust security — Secure communication between monitoring systems
Consistent tooling — Same tools work across all environments
Monitoring stack#
Prometheus collects metrics from Kubernetes clusters and infrastructure. It integrates with Thanos for high availability and long-term storage, enabling metric aggregation from multiple Prometheus instances.
Grafana provides dashboards for visualising metrics. Developers use pre-built dashboards for CI/CD pipelines, namespace resources, and workload monitoring. Developers can create and share custom dashboards.
Logging stack#
Elasticsearch stores and indexes log data. Logs flow from containers through Filebeat agents to the central Elasticsearch cluster.
Kibana provides the frontend for searching and visualising logs. While Kibana excels at creating visualisations, direct Elasticsearch queries using ES|QL or KQL are more efficient for log analysis.
Logs contain rich metadata including Kubernetes labels, CI/CD information, and SKA-specific fields that enable precise filtering.
Headlamp: Real-time cluster access#
Headlamp provides web-based real-time access to Kubernetes clusters. It simplifies monitoring by displaying pod status, custom resources (like TangoDBs), events, logs, and metadata.
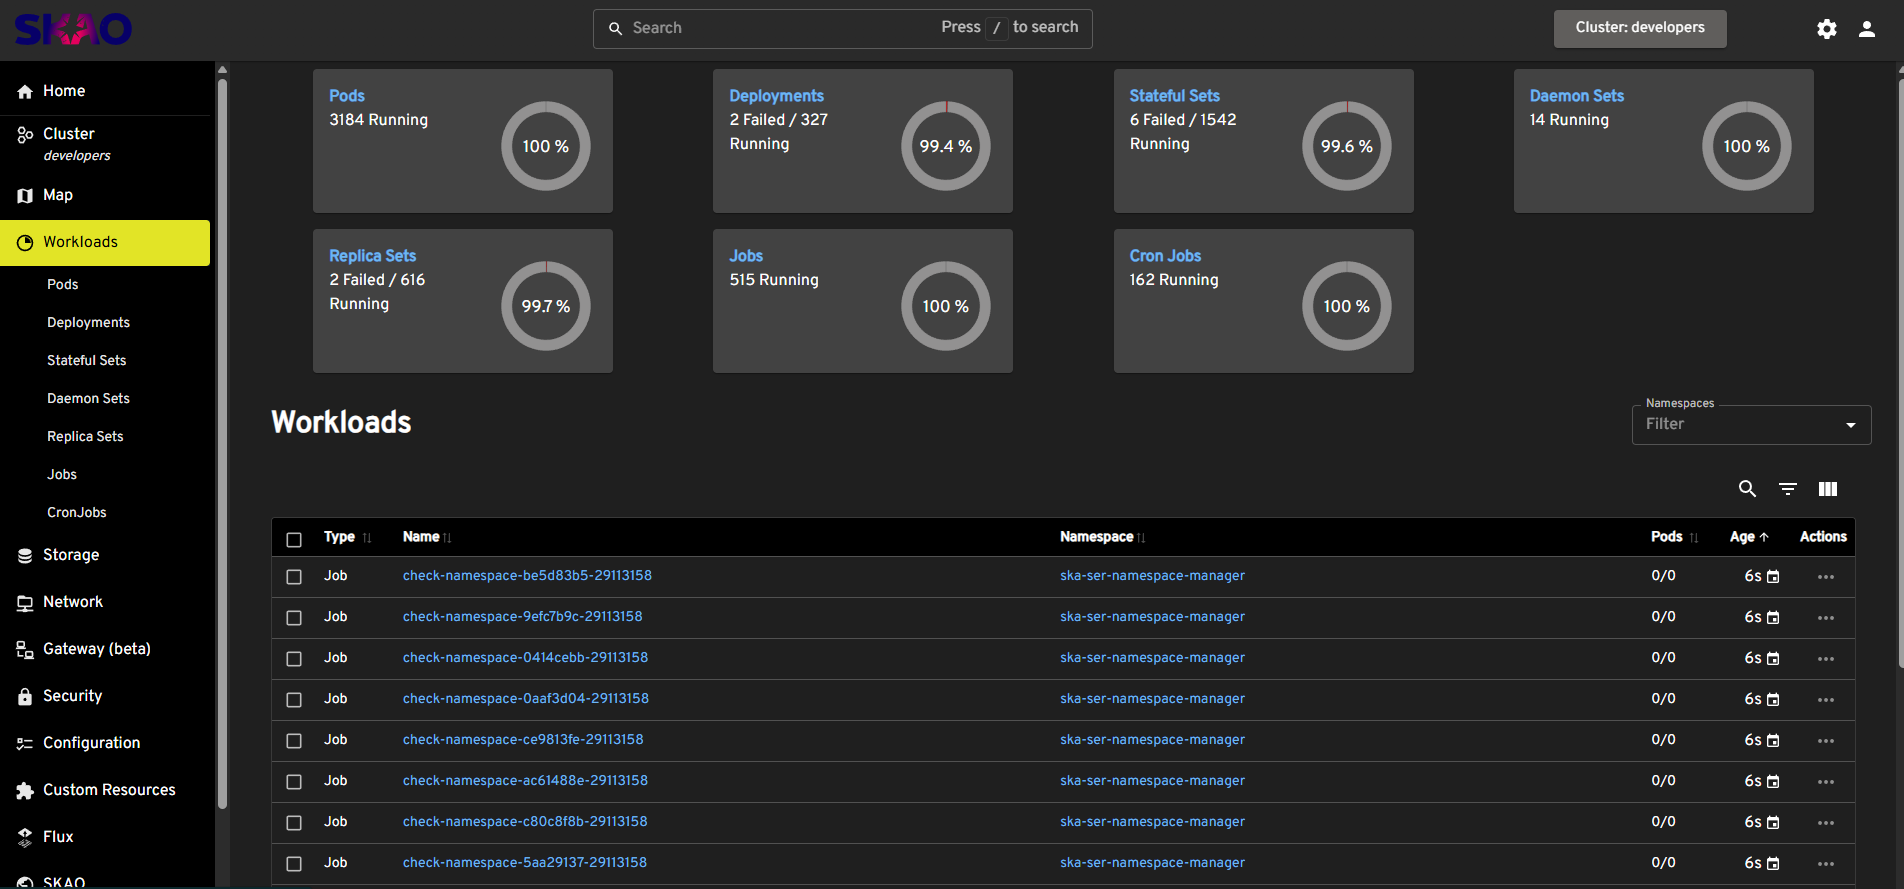
Headlamp home page#
Headlamp includes SKAO-specific views that link to other monitoring solutions.
CI/CD metadata:
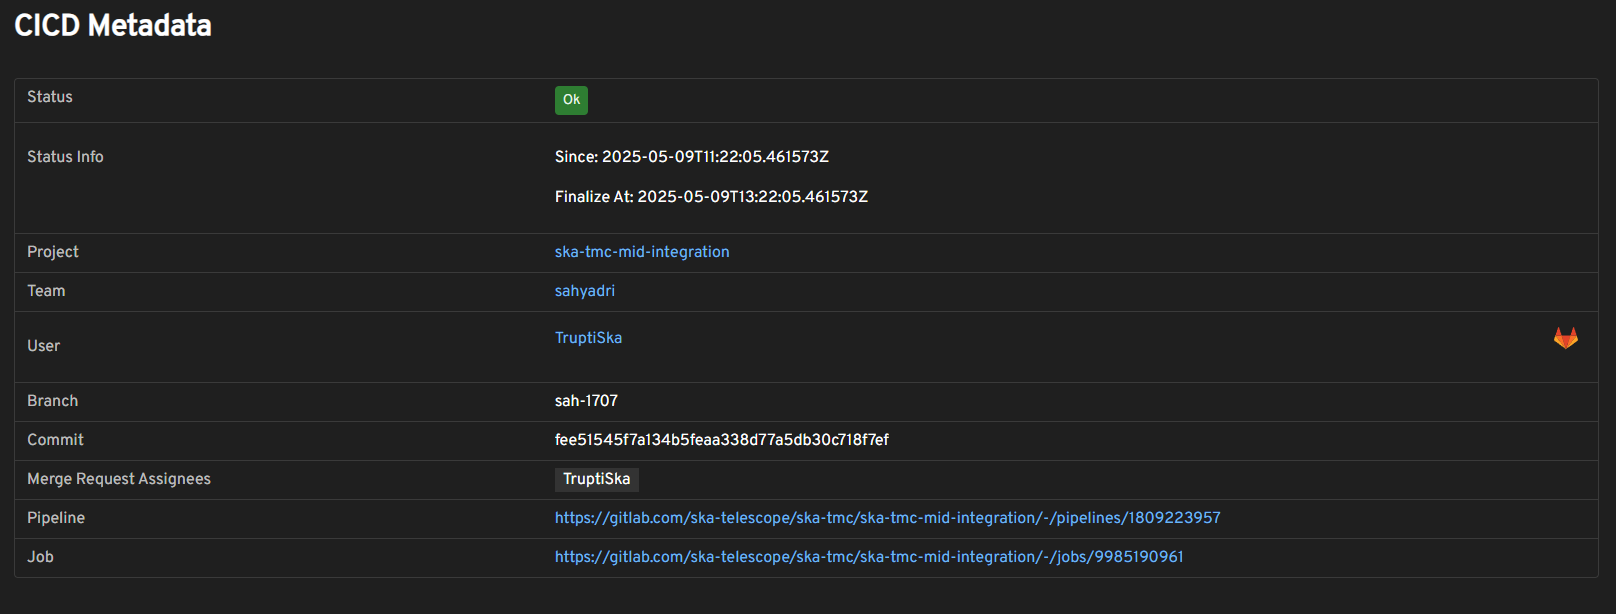
CI/CD metadata in namespace view#
The namespace page shows metadata including the project, team, and links to the GitLab job that deployed it.
Team usage:
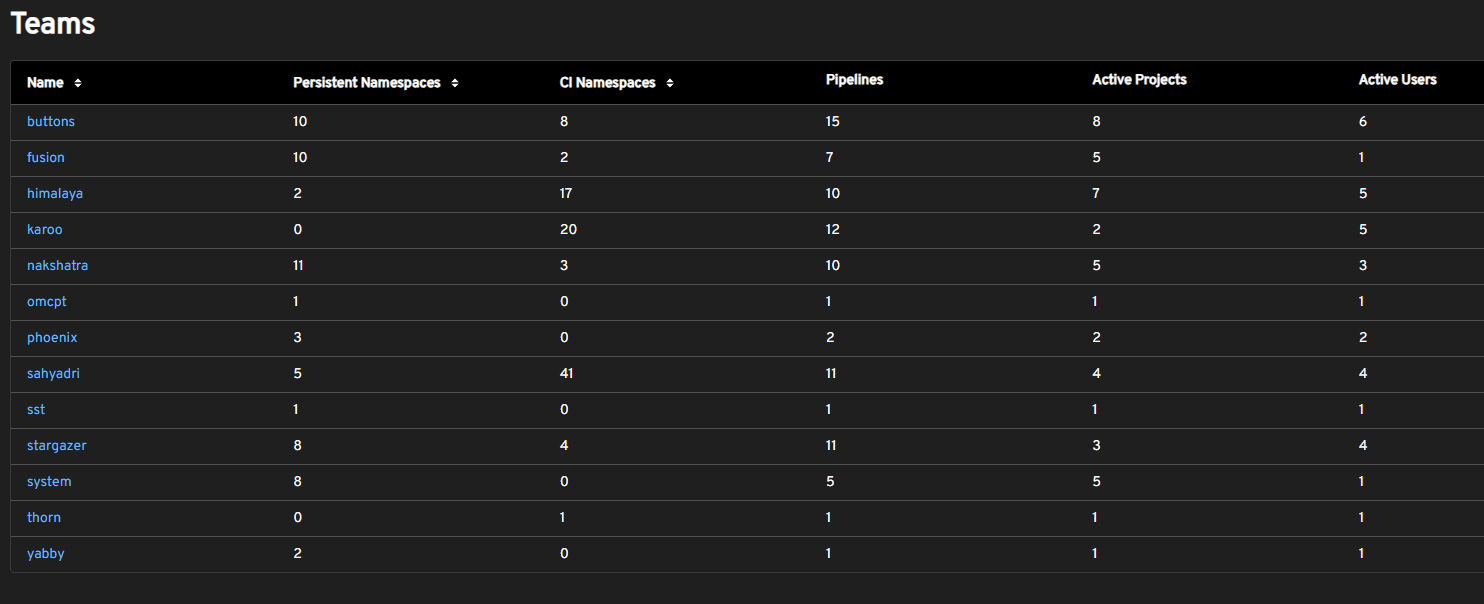
Team namespace usage summary#
Summary views show cluster usage by teams, projects, and users.
Access:
stfc-techops: https://k8s.stfc.skao.int/headlamp
stfc-dp: https://sdhp.stfc.skao.int/headlamp
ITF/AA environments: Local access via InfraHQ
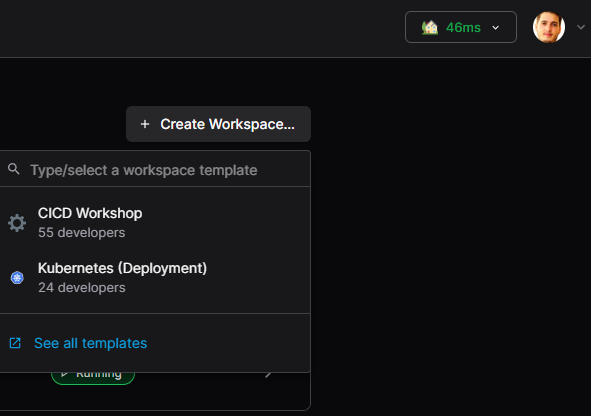
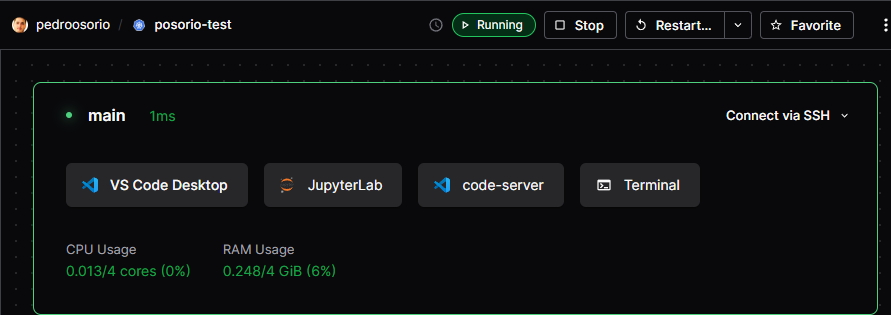
Coder: Remote debugging#
Coder provides self-hosted cloud development environments with IDE integration. Use it when you need to debug applications running in Kubernetes without direct cluster access.
Create a workspace:
After logging in with GitLab, create a workspace using the “Kubernetes” template:
Creating a Coder workspace#
Specify a name and compute requirements (CPU, RAM, disk).
Connect to your workspace:
Coder connection options#
Access options include:
VS Code desktop app
Browser-based JupyterLab
Browser-based VS Code
Browser-based terminal
SSH
Use the terminal:
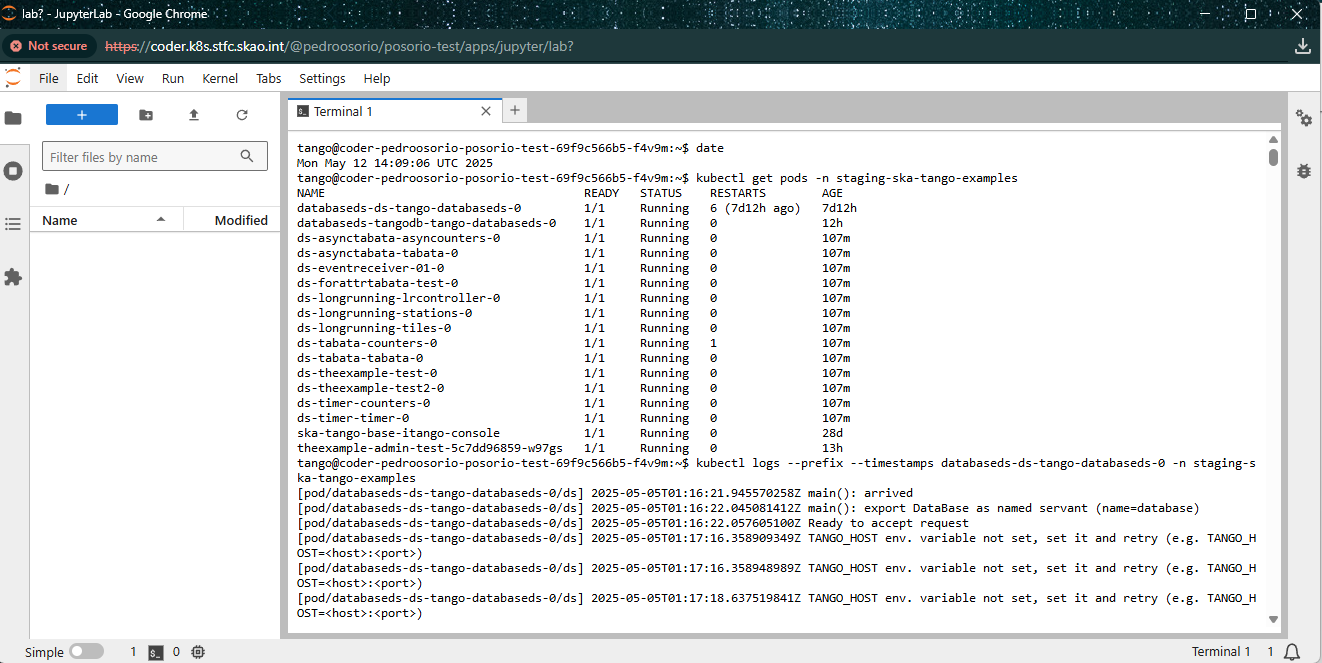
JupyterLab terminal in Coder#
From the terminal, you have limited Kubernetes access to view pod logs, describe resources, and more. The terminal includes Helm, K9s, and tango_admin.
Note
Direct cluster access bypasses retention policies — you can view all available logs.
Access:
stfc-techops: https://coder.k8s.stfc.skao.int/login
Other environments: Not currently available
Namespace Manager#
The SKA Namespace Manager actively monitors namespace health. It evaluates each namespace every minute and notifies owners via Slack when issues occur.
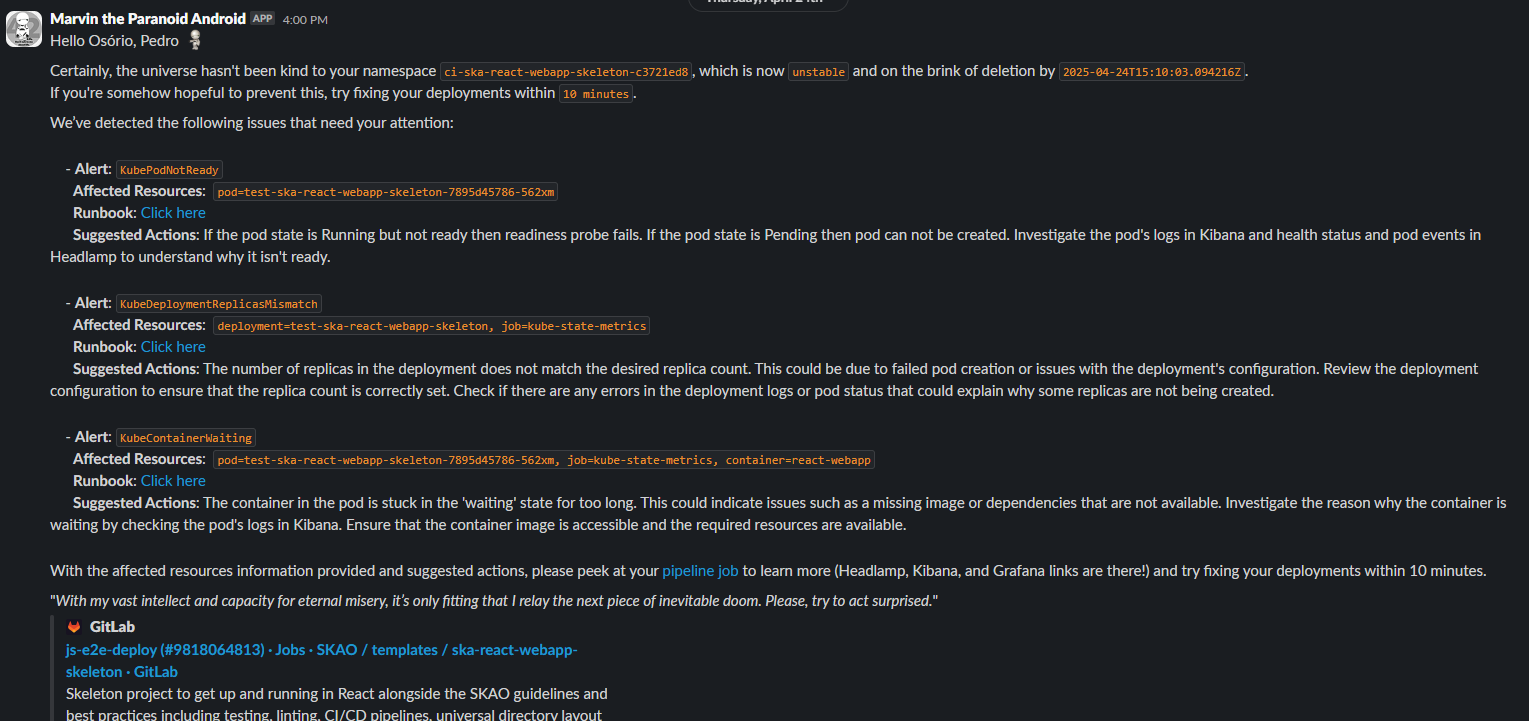
Marvin alerting via Slack#
Alerts include:
Affected resources
Suggestions for resolution
Links to runbooks
Links to the deployment job
This helps identify unhealthy namespaces that may be consuming resources without active use.
Log format design#
The SKA log format balances several goals:
Minimum useful information:
Timestamp for ordering and correlation
Log level for filtering by severity
Extensible tags for arbitrary metadata
Source location for debugging
Easy parsing:
The pipe-delimited format allows simple splitting by delimiter. The fixed number of fields (8 in version 1) enables predictable parsing.
Readability:
Human-readable format for local development without requiring JSON parsing.
Versioning:
The version field allows format evolution. A new version number indicates changes to fields after the first delimiter.
Why not syslog (RFC5424)?
Containerised applications log to stdout, where the container runtime handles routing. The ingestion layer can transform logs to syslog format if needed. The SKA format prioritises container-native patterns and developer ergonomics.
Data retention#
Monitoring and logging data have retention limits:
Logs — Available for a defined retention period (varies by environment)
Metrics — Long-term storage via Thanos, but older data may have reduced granularity
For longer-term log access:
Download pipeline artefacts (available as long as the job exists)
Use Coder for direct cluster access (bypasses retention limits)
Pipeline links include the deployment timeframe, so queries return nothing after the retention period expires.