Monitoring & Logging How-to Guides#
Practical tasks for working with logs and metrics.
Note
Examples use central logging URLs. For production datacentres (low-aa, mid-aa), use the URLs listed in the Monitoring & Logging Reference.
Set up Kibana access#
Guest access (read-only):
Go to Kibana and click Continue as Guest.
Full access:
Create an STS ticket
Log in with your JIRA username and the password from the STS response
Create an API key: Stack Management → API keys

Creating an API key in Kibana#
Test your API key:
curl -k -H "Authorization: ApiKey <your-api-key>" \
  https://logging.stfc.skao.int:9200/_cat/health
Filter logs in Kibana#
Kibana’s Discover view provides log searching with these controls:
Data view — Select index patterns
Date selection — Set time range
Filters — Filter by fields with AND/OR operators
Search bar — KQL expressions (combined with filters using AND)
Field list — Available fields to display
Document view — Matching log entries

Kibana Discover view#
To find Device Server logs in a specific namespace:

Filtering logs by namespace#
Use filters for exact matches and KQL for substring searches. Each filter shows the most common values:

Field value suggestions#
Query Elasticsearch locally#
For efficient log analysis, query Elasticsearch directly using ES|QL.
Find logs by namespace and component:
API_KEY=<your-api-key>
curl -qk -X POST "https://logging.stfc.skao.int:9200/_query?format=json&pretty" \
  -H "Authorization: ApiKey $API_KEY" \
  -H 'Content-Type: application/json' \
  -d '{
    "query": "FROM filebeat-8* | WHERE ska.datacentre == \"stfc-techops\" AND ska.environment == \"production\" AND kubernetes.namespace == \"ska-ser-namespace-manager\" AND `kubernetes.labels.app_kubernetes_io/component` == \"api\" | KEEP message | LIMIT 100"
  }' 2>/dev/null | jq -r ".values[][]"
Find logs by GitLab job ID:
curl -qk -X POST "https://logging.stfc.skao.int:9200/_query?format=json&pretty" \
  -H "Authorization: ApiKey $API_KEY" \
  -H 'Content-Type: application/json' \
  -d '{
    "query": "FROM filebeat-8* | WHERE ska.datacentre == \"stfc-techops\" AND ska.environment == \"production\" AND `kubernetes.labels.cicd_skao_int/jobId` == \"10006002600\" | KEEP message | LIMIT 1000"
  }' 2>/dev/null | jq -r ".values[][]"
Sort by oldest first:
Add SORT @timestamp ASC to the query.
Filter by time range:
Add WHERE @timestamp > TO_DATETIME("2025-05-13T05:00:00Z") AND @timestamp <= NOW().
Filter by container name:
Add WHERE kubernetes.container.name LIKE "test-runner*".
Tip
Build queries in Kibana’s ES|QL mode first, then convert to curl commands.

Enable ES|QL in Kibana#
Use elktail for command-line queries#
elktail provides command-line log queries using KQL syntax.
Installation:
Download binaries from the releases page.
Configuration:
Generate a config file using this snippet, then replace the APIKey value.
Basic query:
elktail -n 1 ska.application: syslog AND ska.datacentre: mid-itf AND message: dnsmasq
Query container logs:
elktail -n 1 "ska.datacentre: mid-itf AND kubernetes.namespace: staging-dish-lmc-ska100 AND kubernetes.statefulset.name: ds-dish-logger-100 AND kubernetes.container.name: deviceserver"
Custom output format:
elktail -n 1 -F "%ska_log_timestamp :: SEV: [%ska_severity] MSG -> %ska_message" \
  "ska.datacentre: mid-itf AND kubernetes.namespace: staging-dish-lmc-ska100"
Inspect raw JSON:
elktail -p -n 1 ska.application: syslog AND ska.datacentre: mid-itf
Use Grafana dashboards#
Access Grafana:
Click Sign in with Azure AD
Use
<jira-username>@<community.skao.int or assoc.skao.int>with your JIRA password
Browse dashboards:

Browsing Grafana dashboards#
Create and share dashboards:
Follow the Grafana dashboard guide to create custom dashboards.

Sharing a Grafana dashboard#
View logs in Grafana#
Several Grafana dashboards include integrated log views:

Pod logs in Grafana#
The log timeframe adjusts automatically to match the dashboard selection. You can filter using the same fields available in Kibana:

Log fields in Grafana#
Check Prometheus alerts#
Alert Manager UI (requires VPN):

Prometheus Alert Manager#
Slack alert channels:
STFC datacentre:
Application alerts: #techops-alerts
Developer alerts: #techops-user-alerts
DP datacentre:
Application alerts: #dp-platform-alerts
Developer alerts: #dp-platform-user-alerts
Monitor namespace health#
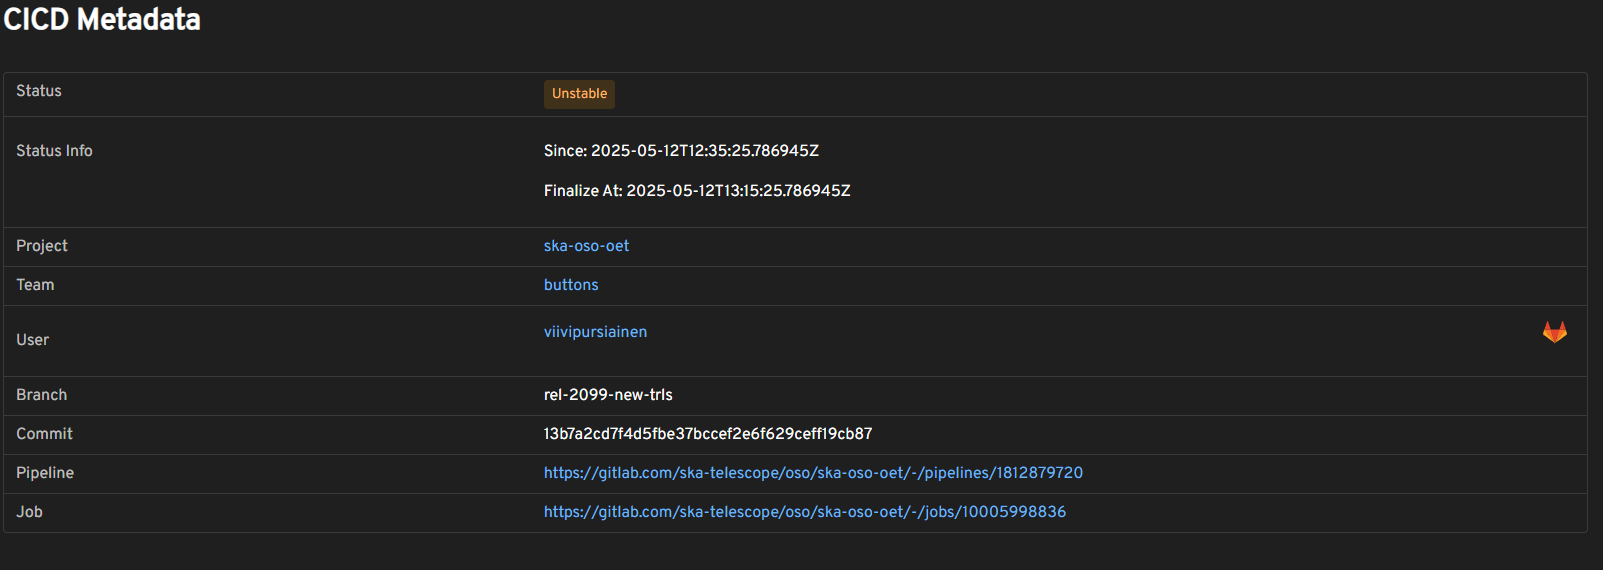
The SKA Namespace Manager monitors namespace health and sends Slack notifications when issues occur:
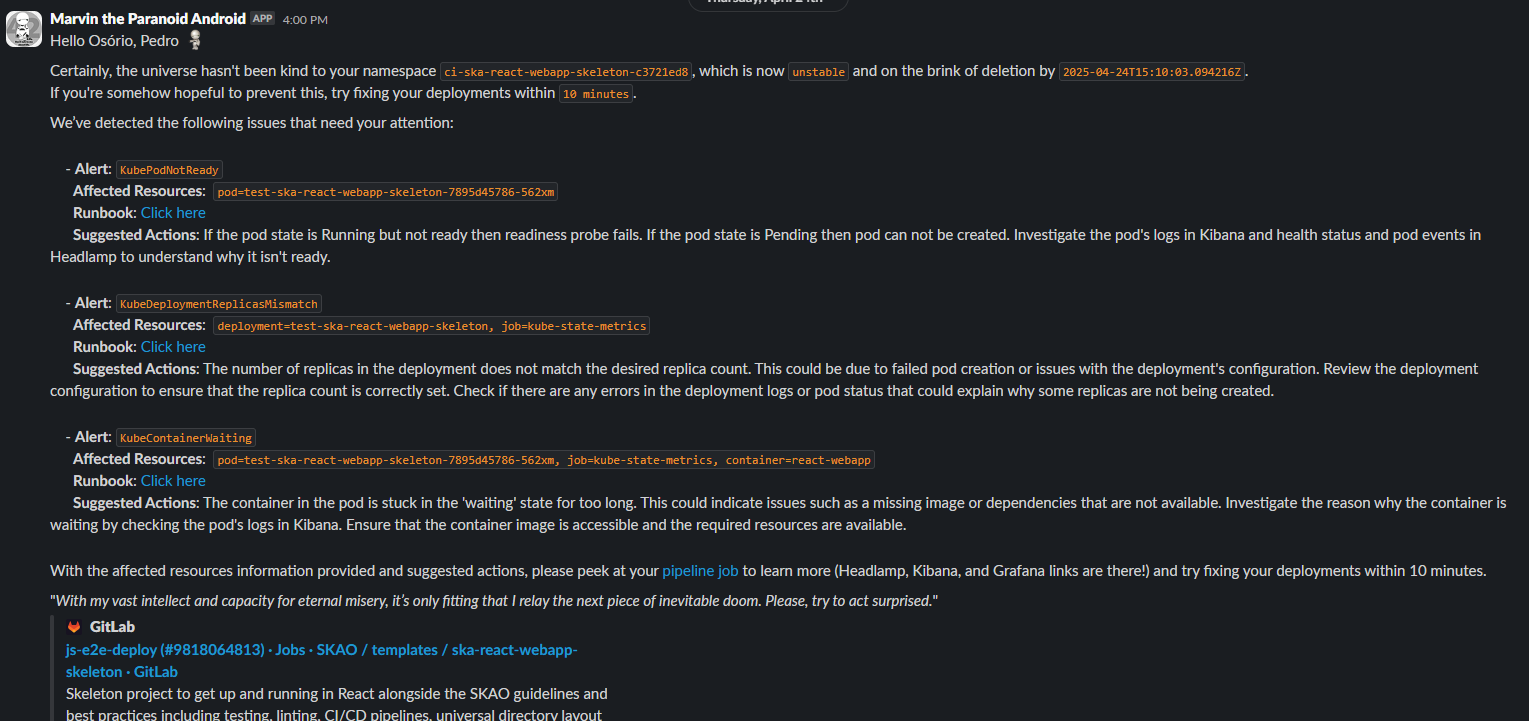
Namespace health alerts from Marvin#
Alerts include affected resources, suggestions, and runbooks. They link to the GitLab job that deployed the namespace.
View namespace status in Headlamp:
Namespace status in Headlamp#
Use make targets#
These make targets support monitoring and logging workflows:
# Show pods, images, and Helm dependencies
KUBE_NAMESPACE=<namespace> HELM_RELEASE=<release> make k8s-namespace-info

# Generate prebuilt monitoring URLs
make k8s-namespace-links

# Output logs for all pods (use VERBOSE_WAIT=true in pipelines)
VERBOSE_WAIT=true KUBE_NAMESPACE=<namespace> make k8s-podlogs
The pipeline machinery calls these targets automatically.