Monitoring Solution
Todo
This page is undergoing rework
Prometheus and Thanos
The central monitoring solution is based on Prometheus, integrated with Thanos, providing high-availability and long-term storage capabilities while allowing for the data aggregation from multiple Prometheus targets.
Grafana
To monitor SKA Infrastructure related metrics from, for example, Kubernetes, Gitlab Runners, Elasticsearch or Ceph, Grafana dashboards should be used.
Info
To log in, choose the “Sign in with Azure AD” option and use the <jira-username>@<community.skao.int or assoc.skao.int> and <jira-password> combination. Once logged in, users can browse through the existing dashboards and monitor the desired metrics.
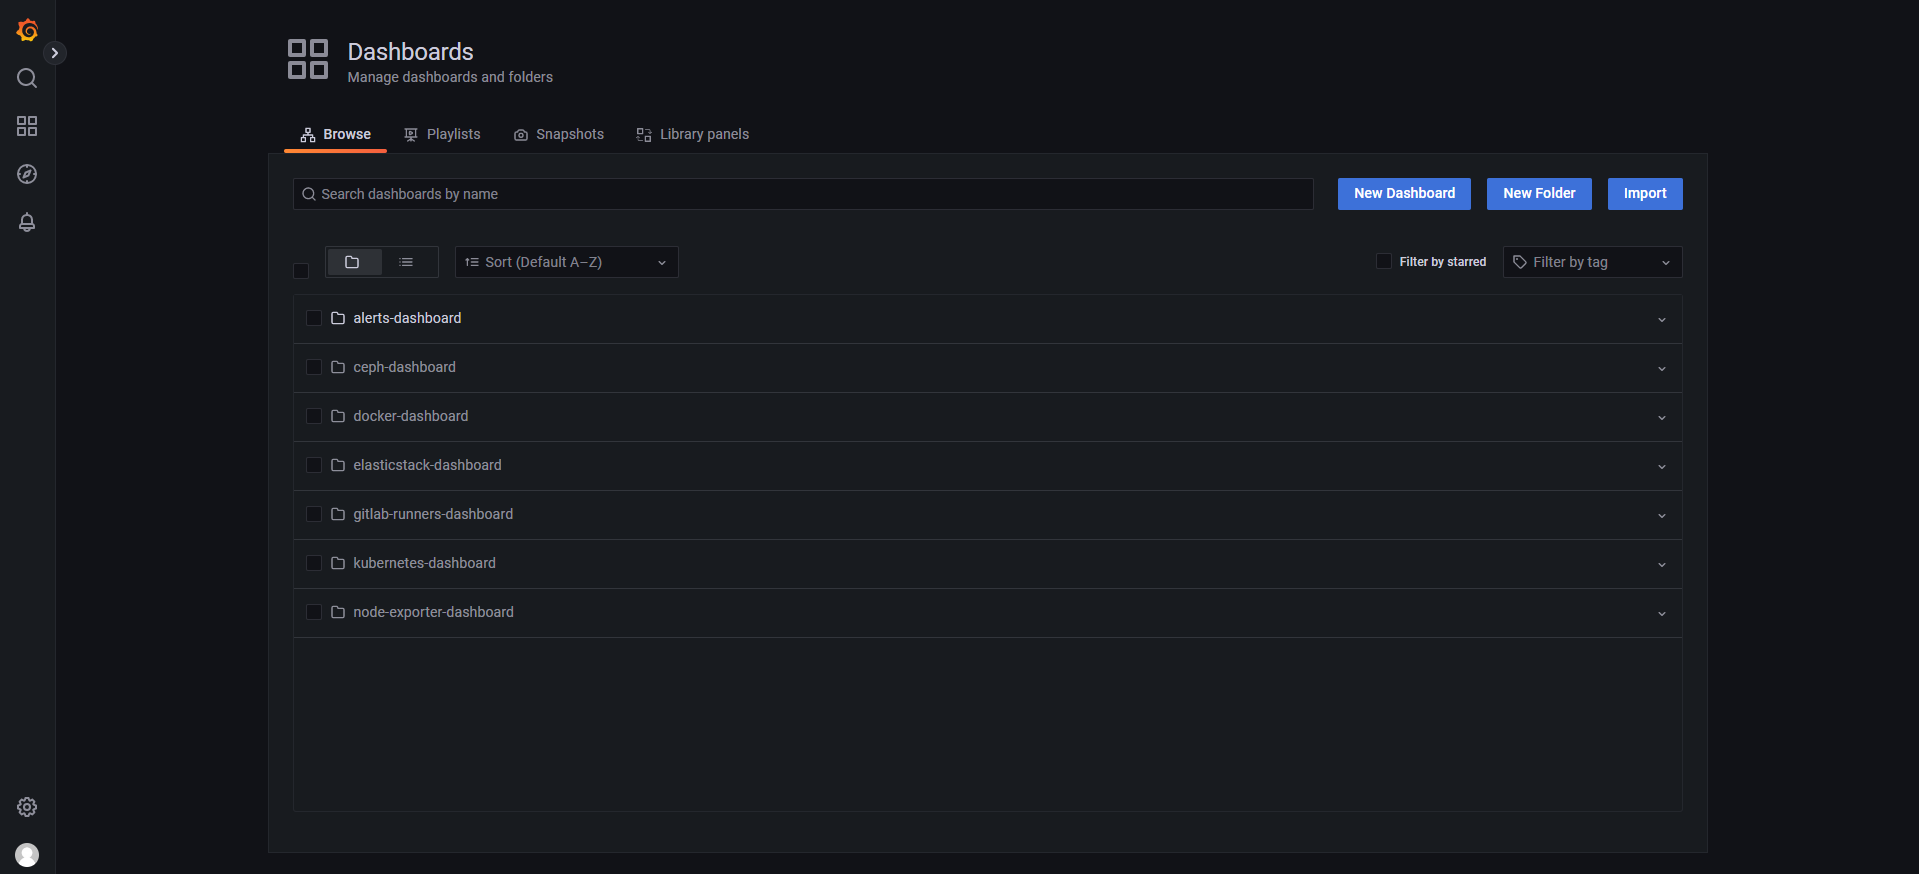
STFC Dashboards Browsing page
Users can also create their own dashboards and share them.
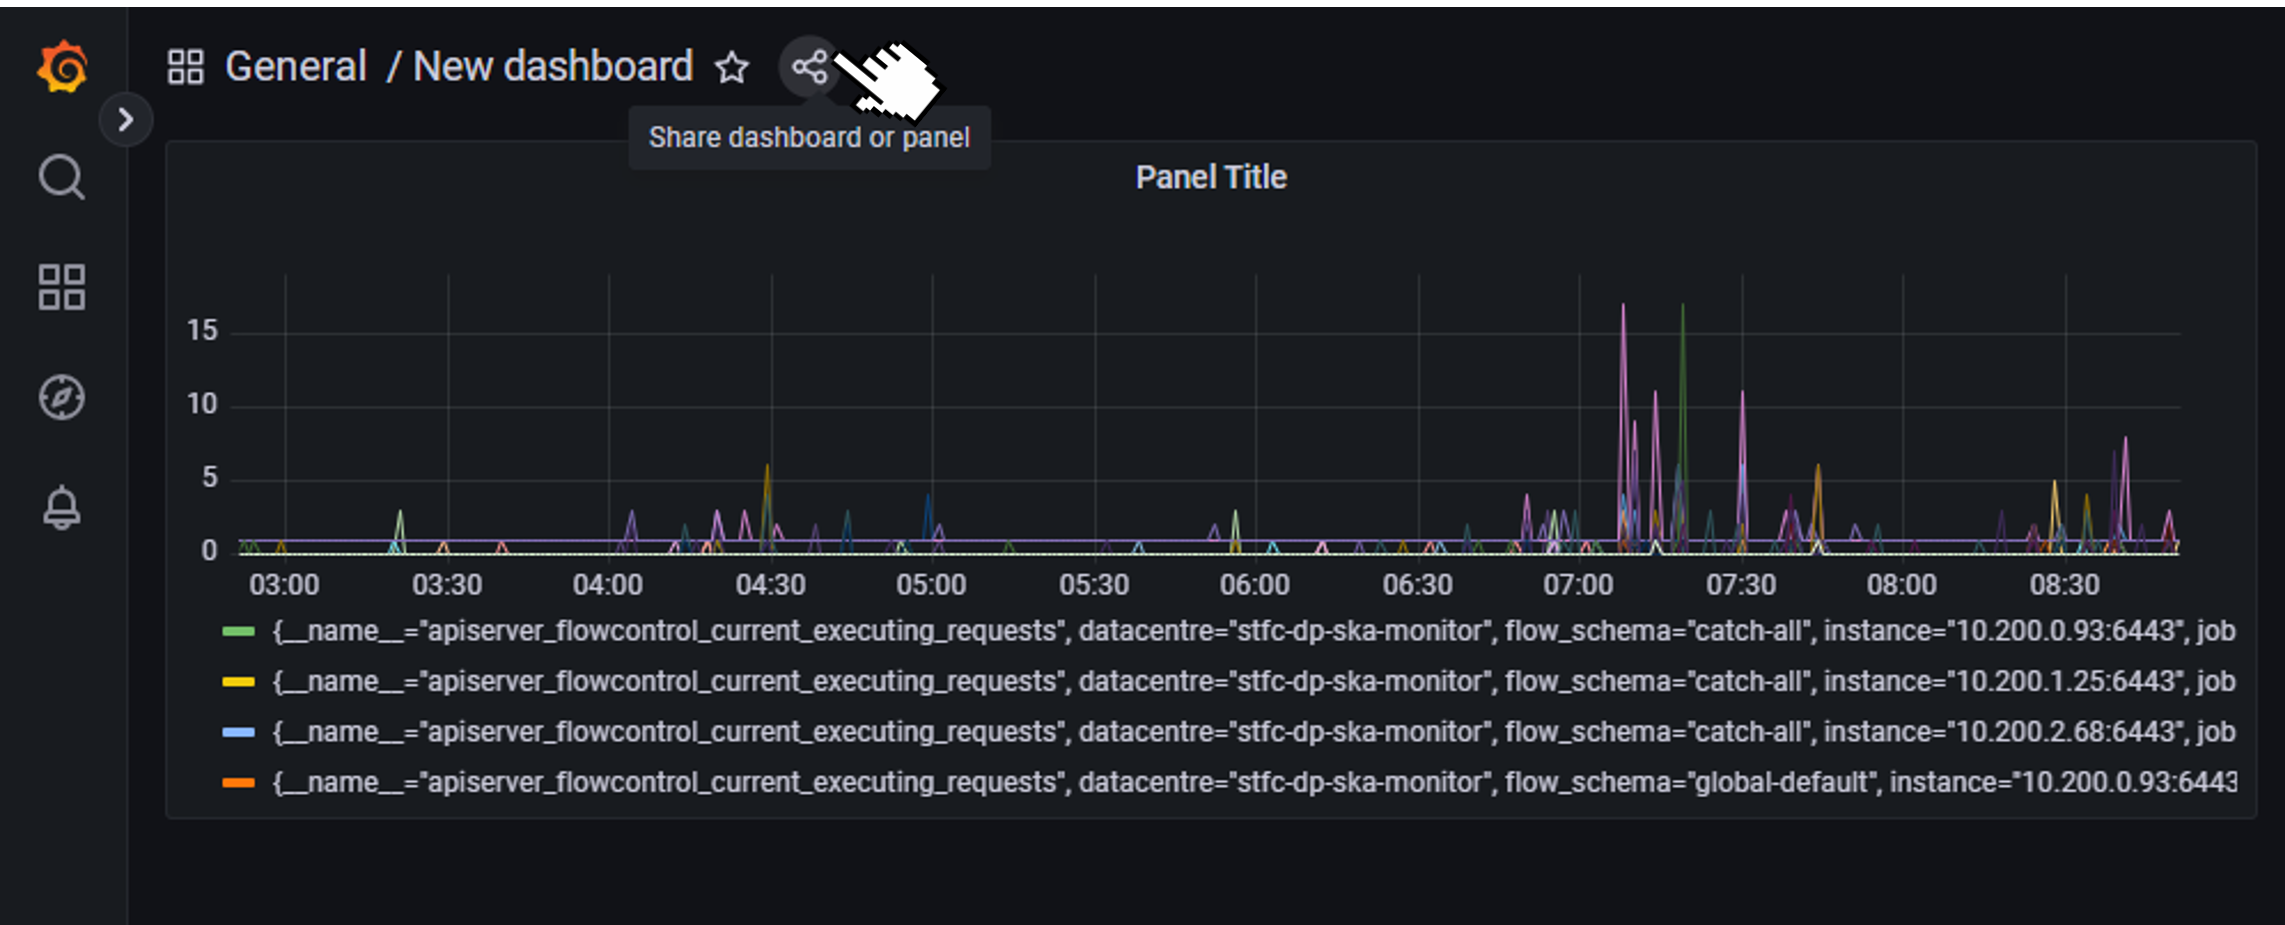
New Dashboard Sharing example
Prometheus Alerts
To check the prometheus alerts, generated for the core kubernetes cluster and the infrastructure VMs, a user can choose between the web access to the Prometheus Alert Manager UI and the Slack alerts channels.
The URLs to access the Prometheus Alert Manager are:
STFC datacentre - http://monitoring.skao.stfc:9093/#/alerts
DP datacentre - http://monitoring.sdhp.skao:9093/#/alerts
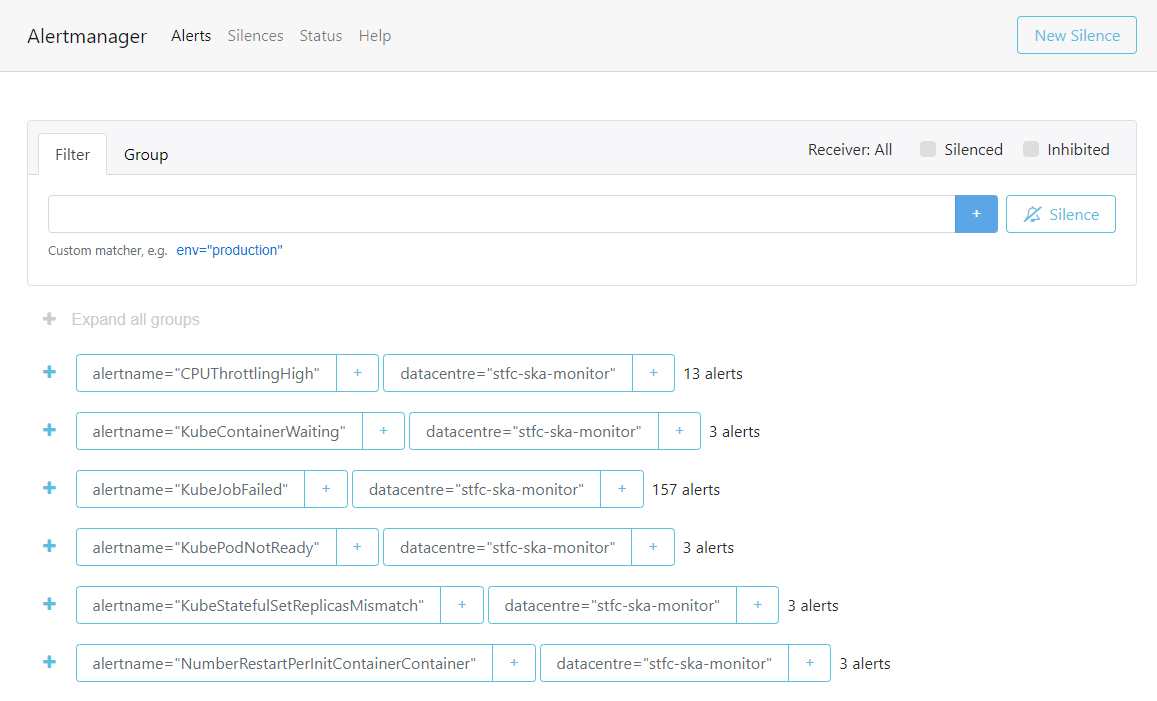
STFC Alert Manager homepage
It is important to note that these URLs are behind a VPN, so VPN access to the corresponding datacentre is required to access them.
There are also two sets of Slack alerts channels, one that serves application alerts and another that serves developer related alerts. These are:
- STFC datacentre
Application alerts - #techops-alerts
Developer alerts - #techops-user-alerts
- DP datacentre
Application alerts - #dp-platform-alerts
Developer alerts - #dp-platform-user-alerts