SKA PST LMC Health Check
The SKA PST.LMC performs a health check between itself and the external core applications via gRPC streams output by the core application gRPC service handlers.
Rather than using a request-response pattern between the LMC and core applications, the health check process uses a background task in the LMC that initiates a request to a core application and expects a response streamed back at a configured period/interval, currently set to 1 second. The core application sends back a response that includes the service name, a universally unique identifier (UUID), the current observation state, and optionally a message if its state is FAULT.
The LMC’s gRPC client will iterate over these results, similar to how the background monitoring process works, and will call a method on the respective component manager that will handle the application’s state. If observation state of both the LMC and the application are the same, then everything is considered healthy. If there is a mismatch, the LMC will keep a count of the number of mismatches and log messages about the mismatch; future changes will allow this to be reported and updating the overall LMC’s health state. If an exception is raised during the gRPC response, normally the connection closed, then the LMC will log the error and attempt to reconnect.
When the PST.BEAM receives a Reset command, it will wait for a service unavailable exception to be
raised by the health check process before attempting to reconnect to the service. During reset,
the core application will exit the process with a non-zero exit code, which will signify to the Kubernetes
cluster that the container should be restarted. After it has restarted, the container will be attached once
again to the associated Kubernetes service.
![@startuml LMC Health Check
actor Operator as OP
participant "Component Manager" as CM
participant "gRPC API" as API
boundary "App Service" as AS
activate CM
activate API
activate AS
CM -> API : connect
API -> AS : connect
AS --> API : connected [service_name, uuid]
API --> CM : connected [service_name, uuid]
CM --> CM : set health "OK"
CM -> API : start health check [background task]
API -> AS : health check
loop stream results
AS --> API : health state
API --> CM : health state
CM --> CM : handle health state
end
OP -> CM : ""Reset ""
CM -> API : reset
activate CM
CM --> CM : wait for health check connection closed
API -> AS : reset
AS --> API : service unavailable
API --> CM : health check connection closed
deactivate CM
CM --> CM : set health "UNKNOWN"
CM -> API : connect
deactivate CM
deactivate API
deactivate AS
@enduml](../../../_images/plantuml-df75dd0766faeb36302e4cb01c83b27886cf0144.png)
Sequence diagram showing how health check is handled within LMC
![@startuml Health check LMC to App
actor Operator as OP
participant LMC
boundary "App Service" as AS
participant "App [Instance 1]" as A1
participant "App [Instance 2]" as A2
activate LMC
activate AS
activate A1
A1 --> AS : register
LMC -> AS : connect
AS -> A1 : connect [forward]
A1 --> AS : connected [service_name, uuid]
AS --> LMC : connected [service_name, uuid]
LMC -> AS : start health check
AS -> A1: start health check [forward]
loop stream in background
A1 --> AS : health state
AS --> LMC : health state
LMC --> LMC : handle health state
end
OP -> LMC : ""Reset ""
LMC -> AS : reset
AS -> A1 : reset [forward]
activate LMC
LMC -> LMC : wait for health check connection closed
A1 --> A1 : exit
destroy A1
AS -> AS : deregister App [instance 1]
AS --> LMC : health check connection closed
deactivate LMC
alt loop until connected
LMC -> AS : try connect
AS --> LMC : service unavailable
else
activate A2
A2 --> AS : register
LMC -> AS : try connect
AS -> A2 : connect [forward]
A2 --> AS : connected [service_name, uuid]
AS --> LMC : connected [service_name, uuid]
end
LMC -> AS : start health check
AS -> A2: start health check [forward]
deactivate LMC
deactivate AS
deactivate A2
@enduml](../../../_images/plantuml-942489ab83776a0c847b9c698e6663d1cd2fcb18.png)
Sequence diagram showing the interaction between LMC and core application instances that are exposed by a Kubernetes service endpoint
Monitoring health
The PST.BEAM TANGO device exposes an overall health state, as exposed on the base ska_tango_base.SKABaseDevice,
as well as the health state of each subcomponent of the PST subsystem. The following TANGO attributes are
available to be monitored and provide the health state of each individual subcomponent.
Subcomponent |
Attribute |
|---|---|
RECV |
recvHealthState |
SMRB |
smrbHealthState |
DSP.DISK (Voltage Recorder) |
dspDiskHealthState |
DSP.FT (Flow Through) |
dspFlowThroughHealthState |
STAT |
statHealthState |
The overall health of the PST is based on the health of the individual subcomponents based on the following rules:
If all subcomponents are healthy (i.e.
HealthState.OK) then PST is considered healthyIf any subcomponent is considered unhealthy (i.e.
HealthState.FAILED) then PST is considered as unhealthyIf only one subcomponent is in a degraded state (i.e.
HealthState.DEGRADED) then PST is considered to be in degraded stateIf two or more subcomponents are in a degraded state then PST is considered to be in an unhealthy state
If none of the above rules apply and at least one subcomponent’s state is unknown (i.e.
HealthState.UNKNOWN) then PST’s state is also unknown
A subcomponent’s state may be unknown because communication between the PST.BEAM TANGO device and the subcomponent has stopped.
An example of this is when an operator sends a Reset() command to the PST.BEAM, as shown above in the sequence
diagrams. During the period that a core application is restarting the PST.BEAM TANGO device will consider the application’s
health state is unknown.
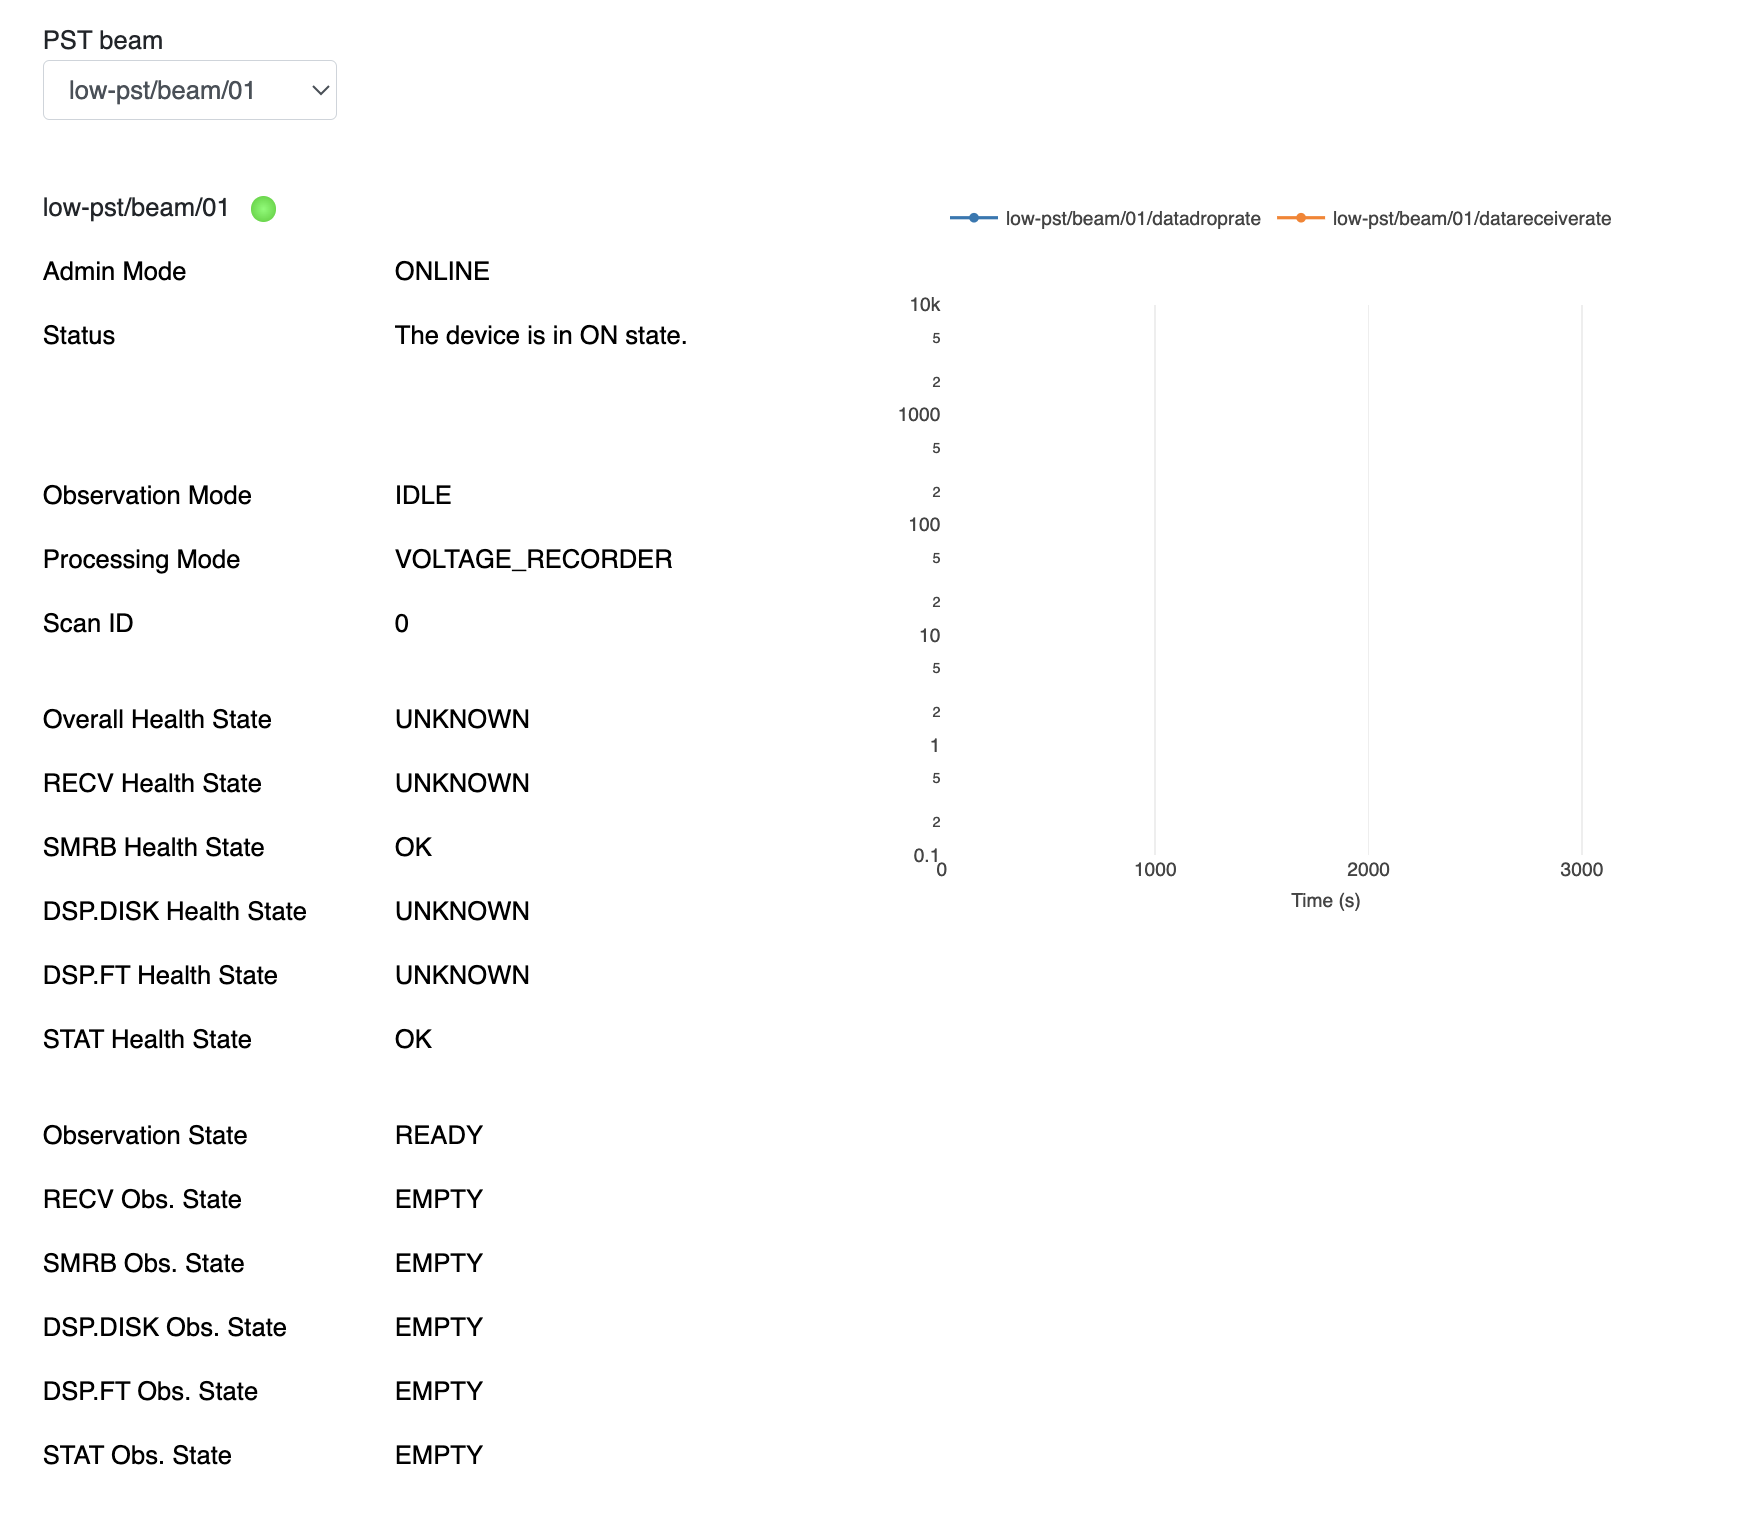
The PST Overview Taranta Dashboard can be used to get an overview of the health state of the subcomponents. The following image shows a screen capture of the PST Overview dashboard while PST is being reset, as the SMRB and STAT subcomponents were in an unknown state the overall state of PST is reported as unknown.