Monitoring Taranta using metrics
Monitoring is useful for understanding when in a running dashboard some anomalies happen.
Metrics
Monitoring taranta involves providing better situational awareness to the users of running dashboards when there are connection problems with underlying devices. The user will quickly notice that something is bad behaving making the dashboard unreliable.
On Taranta, a LED is introduced on the toolbar. This is called Metrics LED which signals if taranta is
receiving data properly from TangoGQL(subscriptions). This is an pulsating LED which changes its color
depending upon the status of subscriptions in TangoGQL. To know about subscriptions status Taranta queries
TangoGQL every X (this can be configured in config.js > FETCH_COMM_HEALTH) seconds to get the status
of the subscriptions. Based on this the color of LED changes.
For eg. On a running dashboard
Metrics Color |
Shape |
Description |
|---|---|---|
Grey |
Circle |
Taranta has not subscribed to any attribute subscriptions |
Green |
Circle |
Taranta is receiving value for all of its subscriptions |
Orange |
Square |
Taranta is not receiving value for one or more subscriptions |
Yellow |
Triangle |
Taranta is not receiving value for any of the subscriptions |
Red |
Triangle |
Taranta is not receiving metrics data from TangoGQL repo |
Taranta periodically checks on TangoGQL to know if Taranta is receiving values correctly for all of its subscriptions. If it receives value for all of its subscriptions LED color would be green If one or more subscriptions from Taranta fails to receive value from TangoGQL, metric LED will automatically change its color from Green to Orange. The LED will change its color back to green subscription is restored. Click on LED to know more about the subscriptions & related things. LED color remain grey when Taranta does not have any active subscription to TangoGQL this is possible When user is on devices and has not clicked any devices.
In below image a taranta dashboard is in running mode with metrics LED color orange, this is because its not receiving values for device/attributeLabel widget.
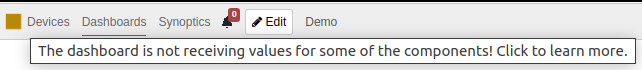
You can click on the LED to see the details, as shown in the example figure.
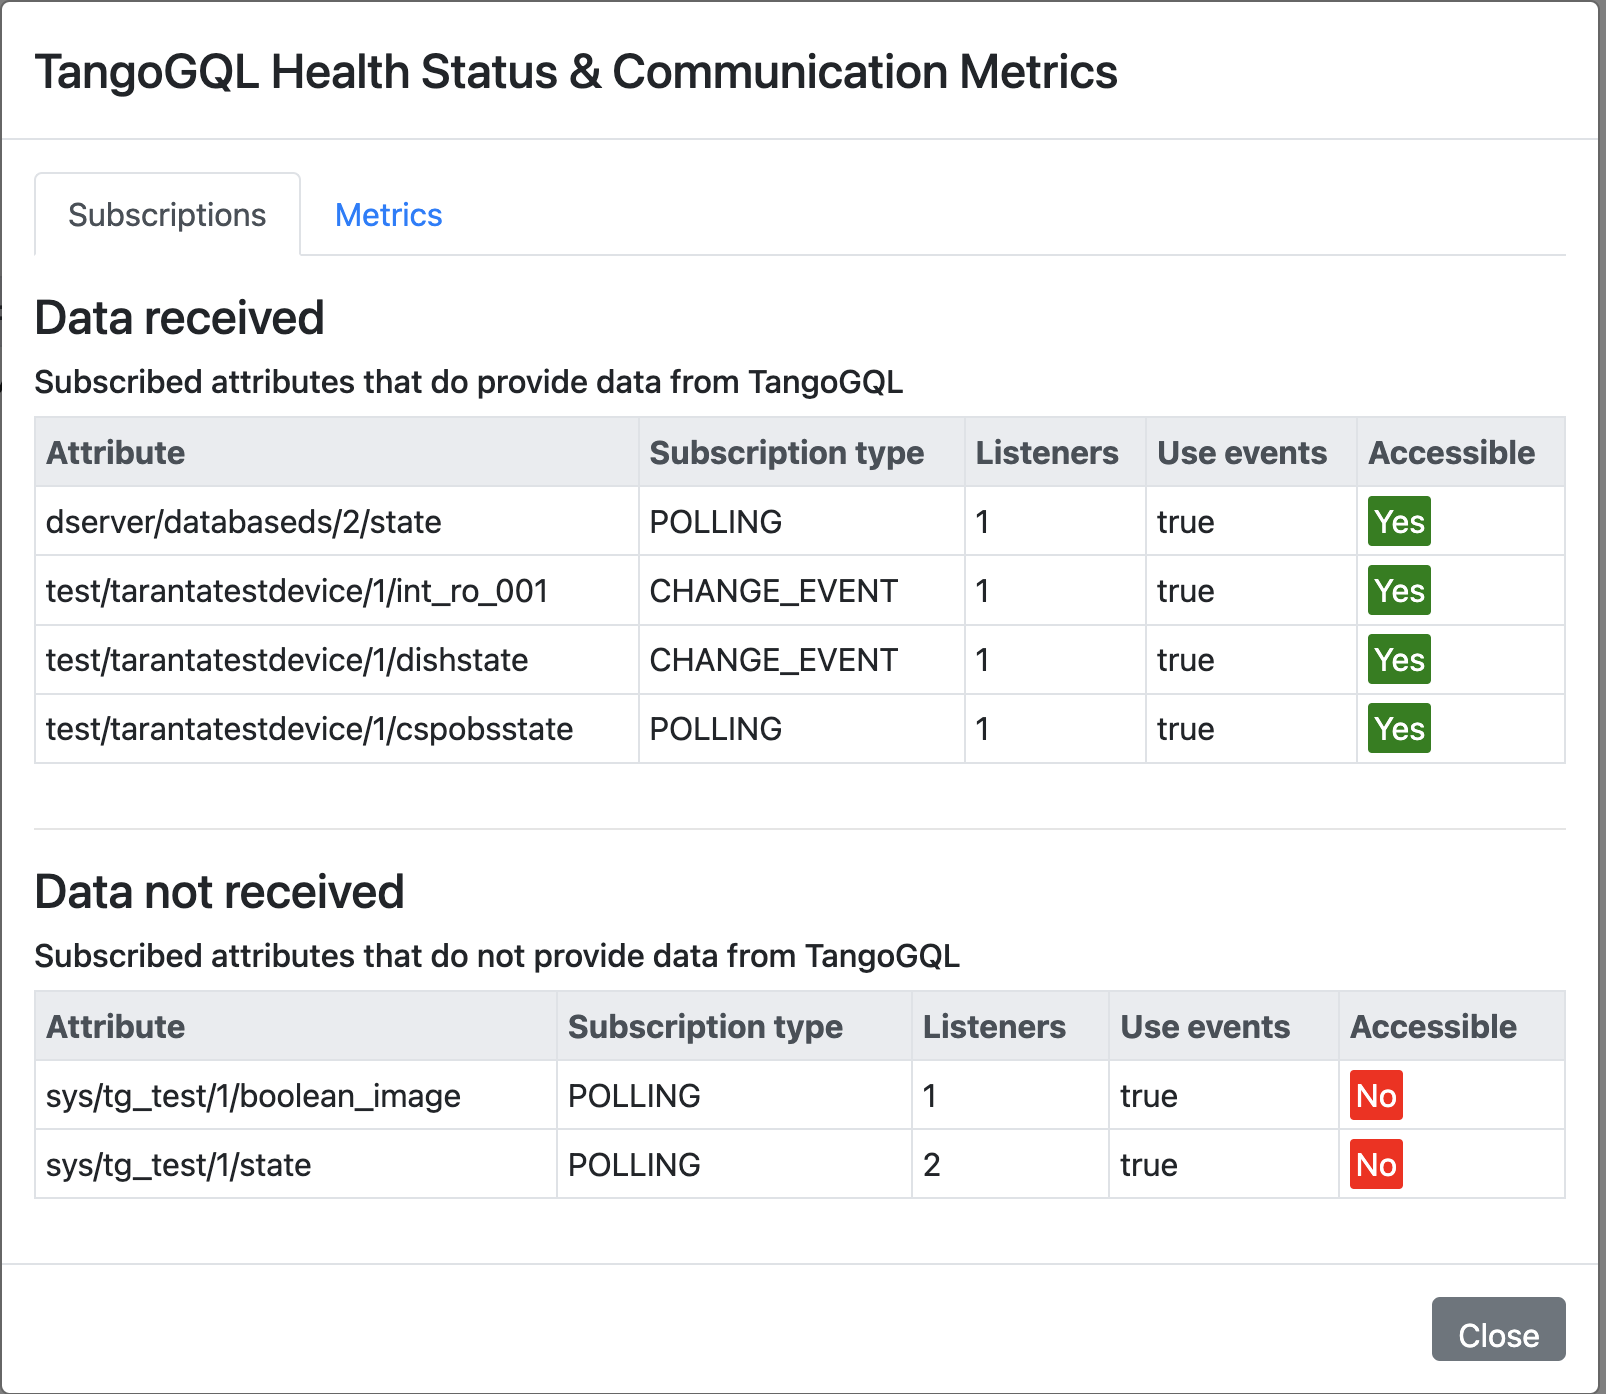
In this case, you can see that a device is not accessible, so the attributes that are not obtaining information are listed. It is also possible to see other types of information provided in this modal, such as the number of listeners, i.e., the number of subscriptions to that attribute, the type of communication: POLLING, PERIODIC_EVENTS, CHANGE_EVENTS, etc.
Finally, in the Metrics tab, you can get information about the performance of TangoGQL. In particular, TangoGQL provides the execution times for the last 10 queries and the last 10 mutations. This allows the user to check how TangoGQL is performing.
It should be noted that the metrics only refer to the default database, not the other connected TangoDBs.