View Execution Page
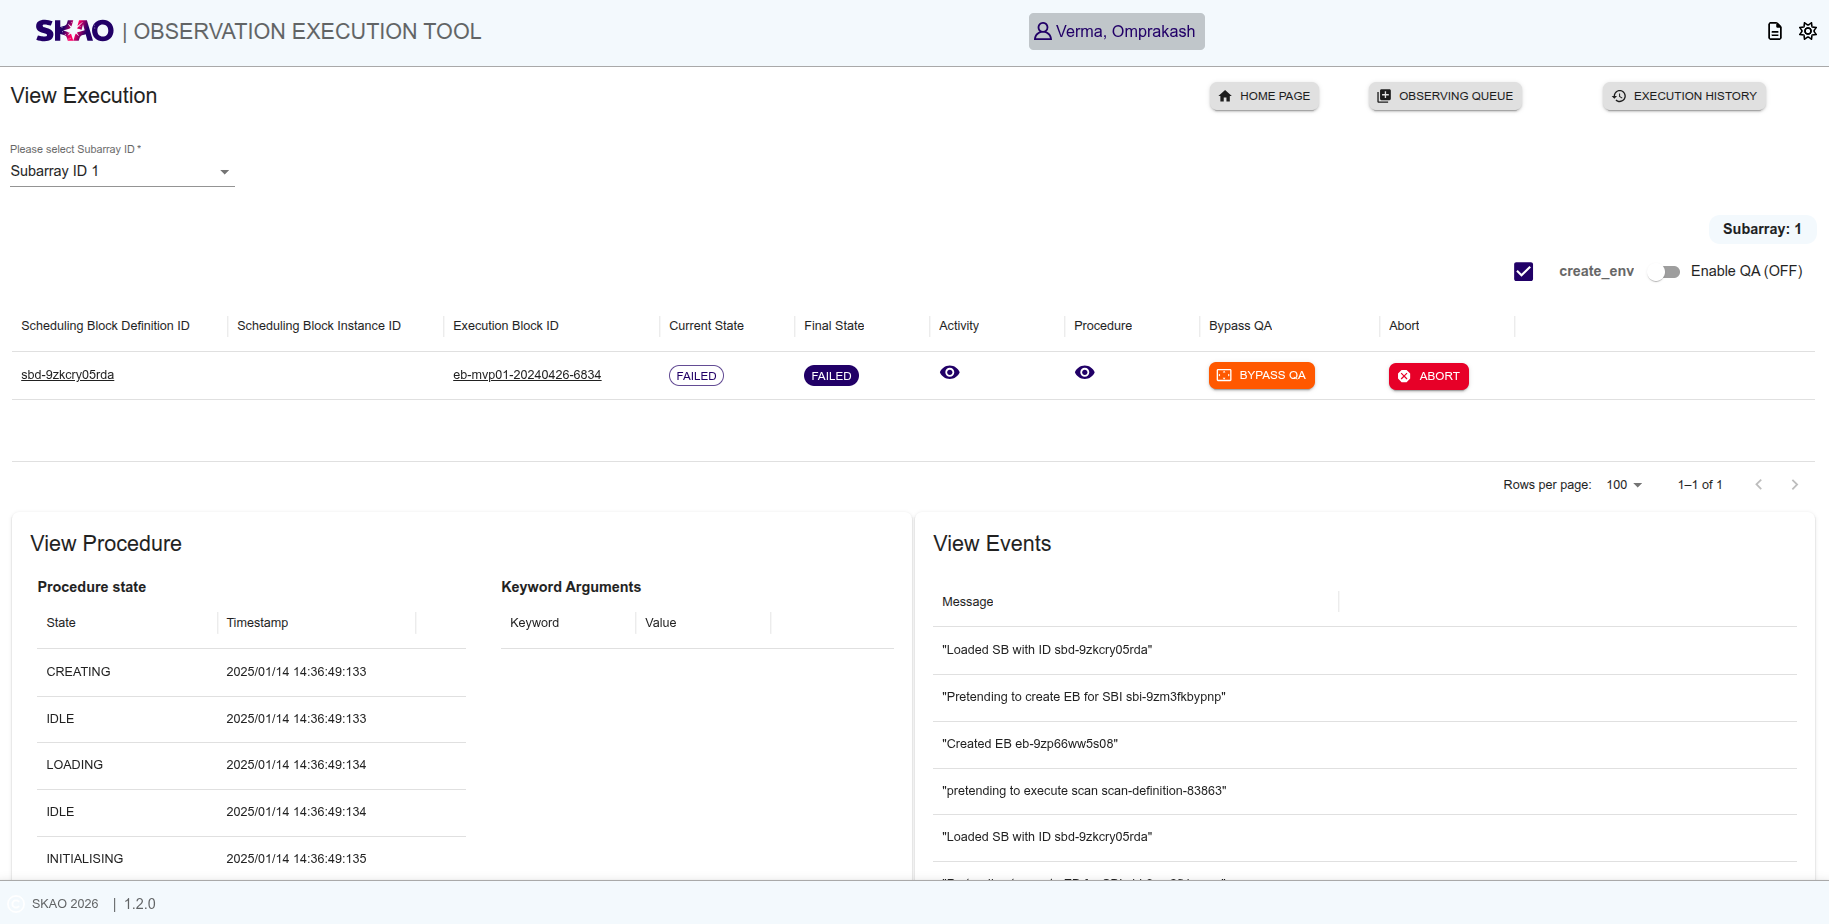
Once Observation Execution Tool(OET) starts execution, user will be able to see execution details in tabular format as shown below by selecting subarray Id from given dropdown on UI.
Table consist of columns such as Scheduling Block Definition ID,Scheduling Block Instance ID,Execution Block ID,Activity Name,Current State,Final State,Activity,Procedure and Abort.
User will be able to view execution for each subarray Id by selecting subarray Id from given dropdown on UI.
User will be able to view execution for all subarray Ids by selecting “All Subarray IDs” ontion from given dropdown on UI.
User will be able to enable/disable QA by using toggle switch from the UI.
User will be able to bypass QA by clicking on  button for respective SBD in execution.
For an overview of the applications and functionality within OET, see OET backend.
Note
Abort functionaly will apply only when execution state is in ‘RUNNING’ state.
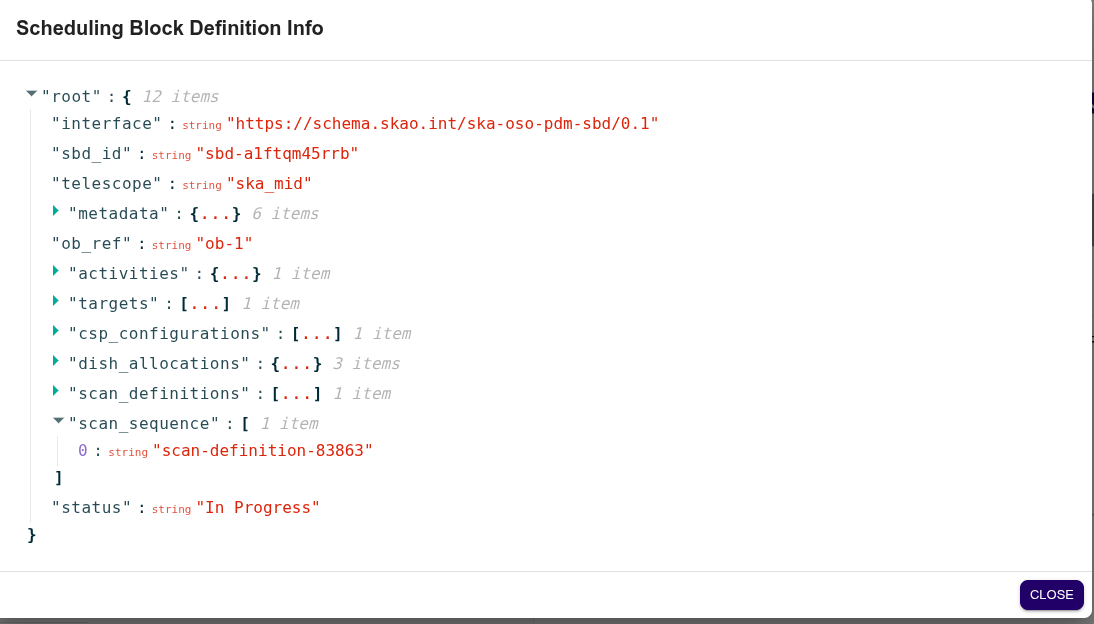
View Scheduling Block Definition
User will be able to view SBD details by clicking on Scheduling Block Definition ID from the table.
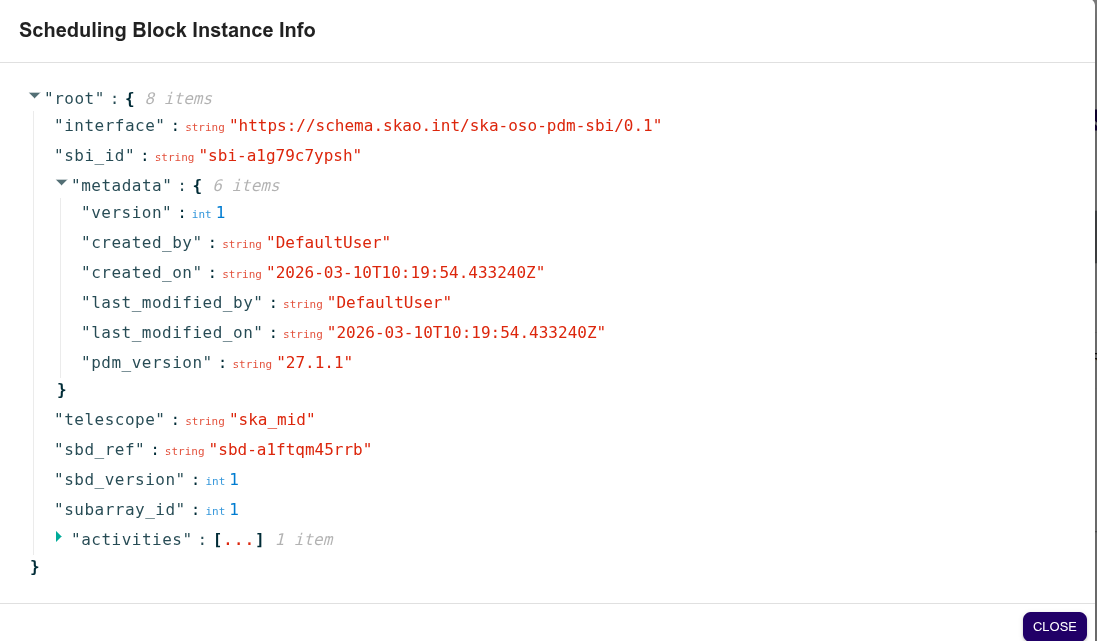
View Scheduling Block Instance
User will be able to view SBI details by clicking on Scheduling Block Instance ID from the table.
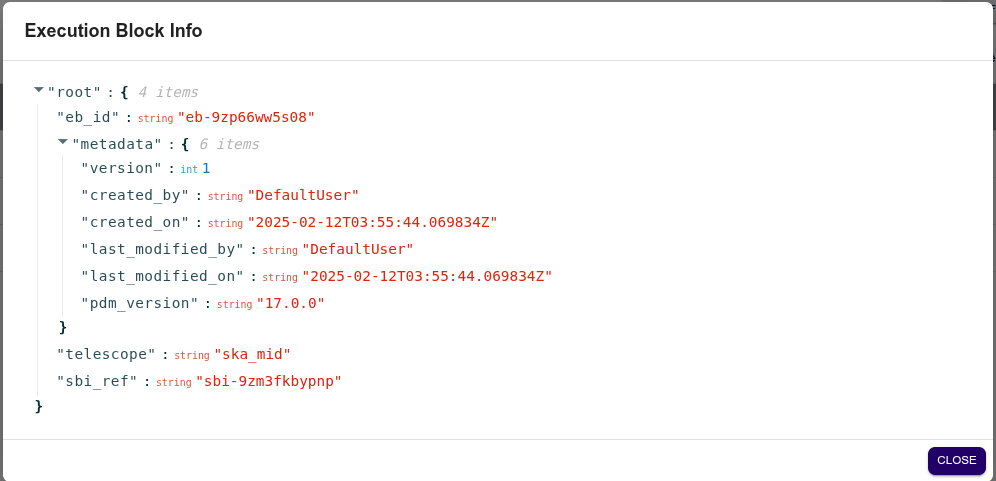
View Execution Block
User will be able to view EB details by clicking on Execution Block ID from the table.
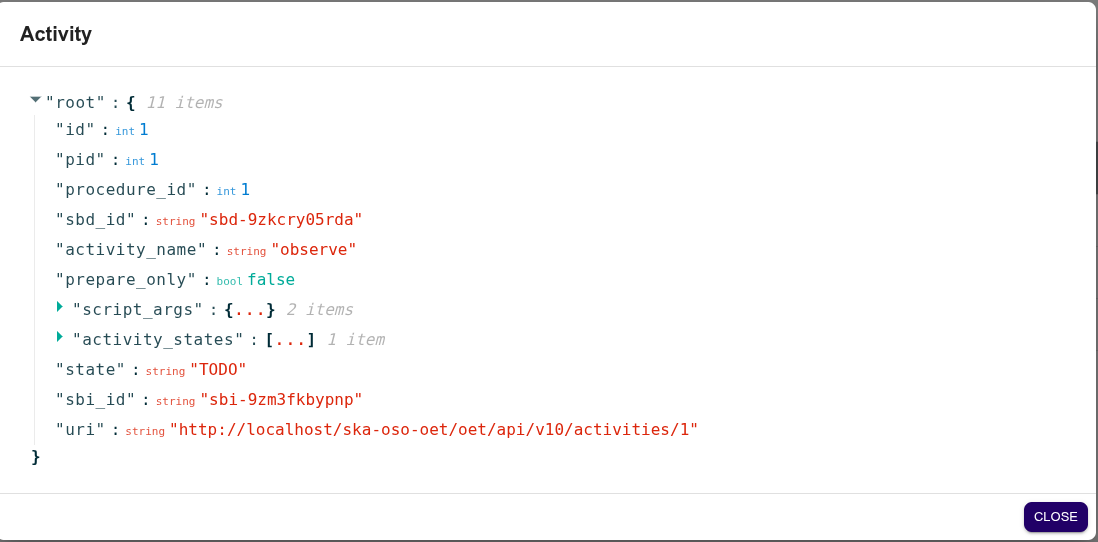
View Activity
User will be able to view activity details by clicking on icon  from ‘Activity’ column from the table.
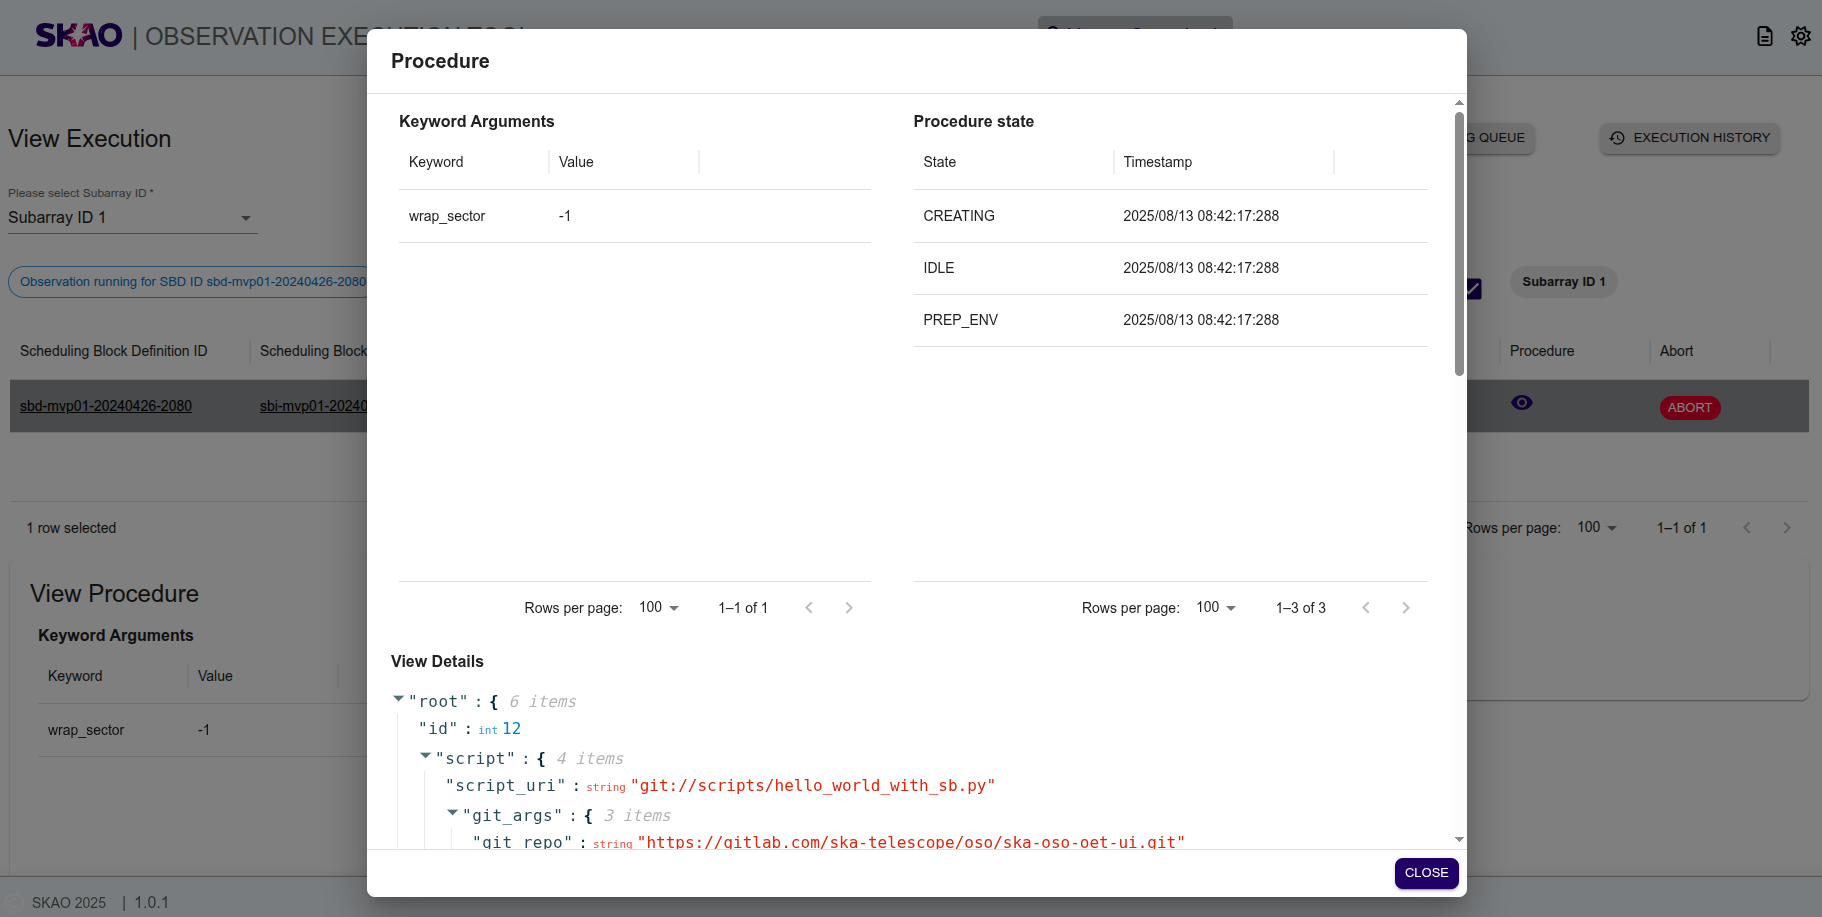
View Procedure
User will be able to view procedure details by clicking on icon from ‘Procedure’ column from the table.
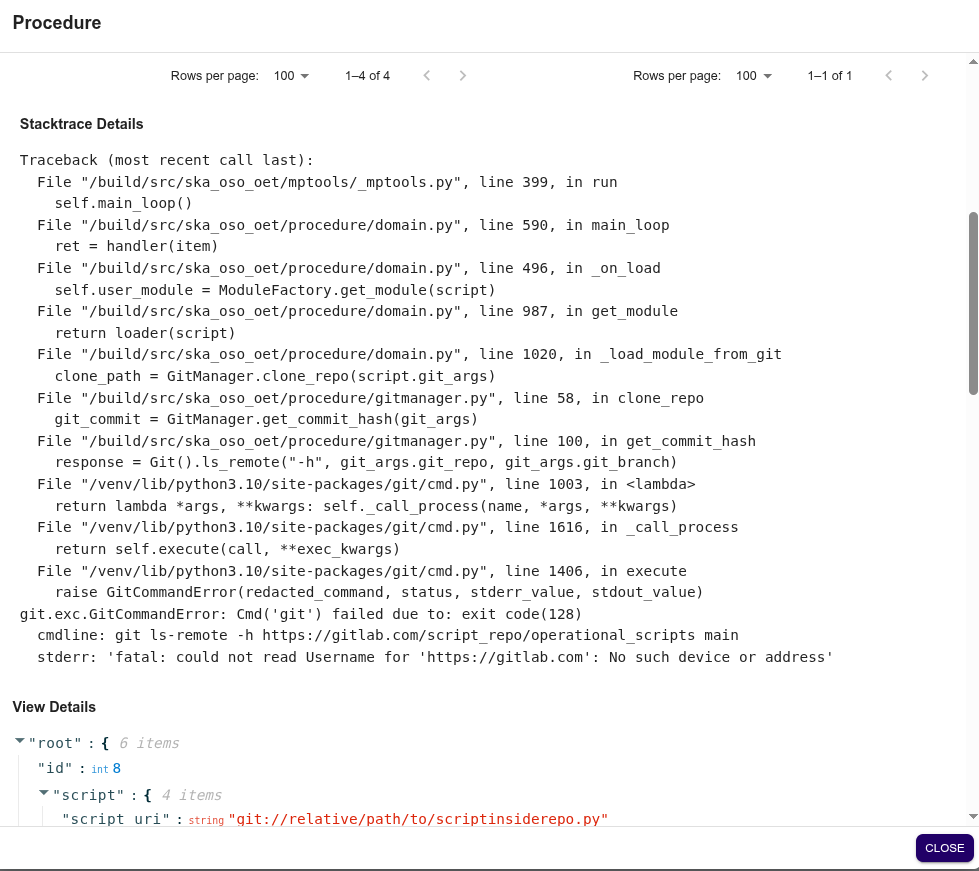
Procedure details with error details when failed.
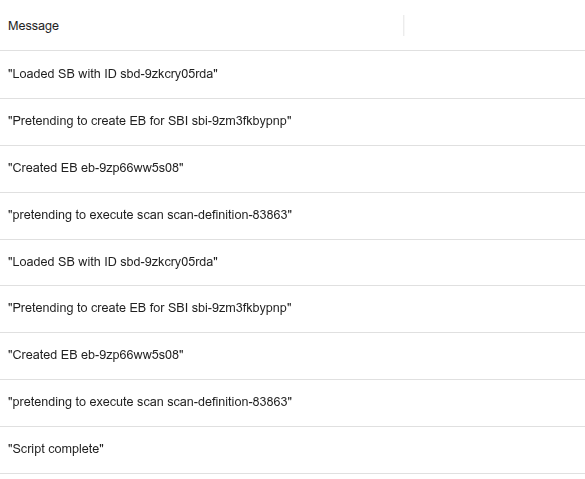
View Events
User will be able to view events send by Observation Execution Tool during execution of Scheduling Block Definition.