RFI Blanking Test
Purpose
This test checks the RFI detection & blanking functionality by confirming that the correct number of frames in the raw station beam output are blanked when a step function input is applied at the ADC with RFI blanking enabled.
Test:
Applies a step function (constant amplitude of 63 units) to ADC inputs using the in-built ADC test pattern generator
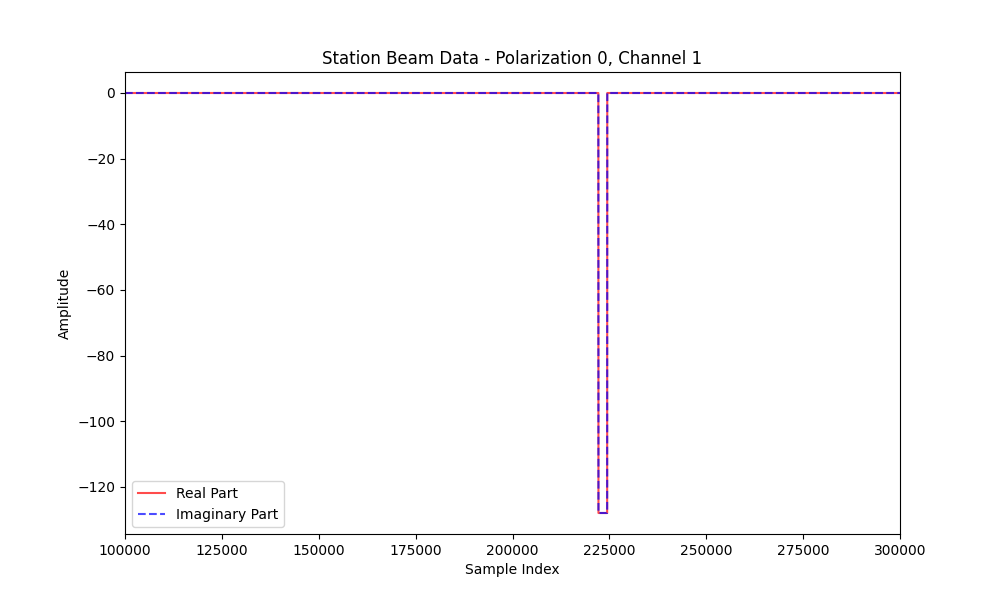
Verifies that blanked samples appear as -128 + -128j in complex representation
Verifies that the raw station beam output contains the expected number of blanked samples (2272-2274 frames)
Validates that the RFI counters (
rfi_counts) match the expected number of RFI-affected ADC frames (2251-2253 frames)
Test Output:
The plot below shows the station beam output in channel 1 polarisation 0 produced as a result of the step function applied in the test. It is seen to contain a continuous fixed pulse of blanked samples as expected.
NOTE: This test currently supports only 1 TPM and 1 antenna.
Methodology
Connect to station and configure initial parameters.
Configure and enable RFI blanking.
Configure the Network addresses & DAQ.
Configure ADC in-built pattern generator to output 0s and clear broadband RFI counters.
Capture raw station beam data while the step is applied using the ADC in-built pattern generator.
Evaluate: Step ADC input should result in a fixed number of blanked station beam samples within expected range.
Validate: RFI counter value should match expected number of RFI-affected ADC frames.
Understanding the Expected RFI Behaviour
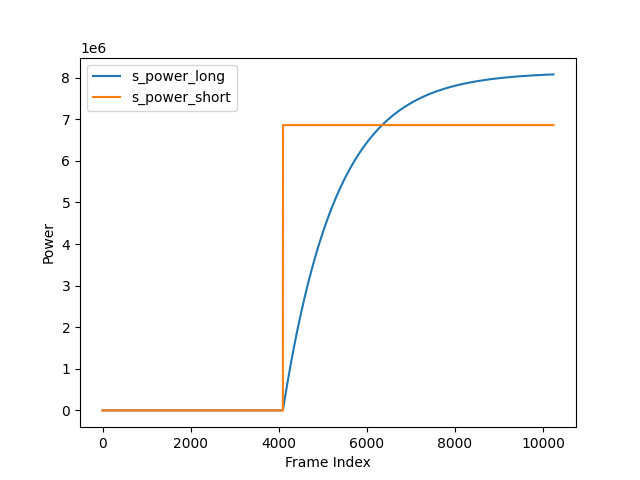
Before the step signal is applied, both the long-term and short-term averages are zero. When the step occurs, the short-term average rises above the long-term average, causing the RFI flag to be asserted for that frame. The flag stays high until the long-term average approaches the short-term average after a certain number of frames. This number is derived mathematically in the next section to be approximately 2252.85 frames (when RFI factor = 1). Because deassertion happens only at frame boundaries, this results in 2253 RFI-flagged ADC frames when the step aligns exactly with a frame boundary.
- In practice, several timing factors introduce small variations:
Short-term average updates every 2 frames.
Long-term average updates every 1 frame.
The step may occur anywhere within a 216-sample frame.
Convergence (2252.85 frames) rarely aligns exactly with a frame boundary
Because of these factors, the expected number of flagged ADC frames falls within 2251-2253.
The RFI counter exposed by the TPM API (rfi_counts) is expected to fall in this range. This range is further validated by feeding a step function as input into the Python model of the RFI detection module in firmware.
Each time-domain ADC frame affects 22 frames in the frequency-domain (see RFI Blanking).
Therefore, 2253 ADC frames correspond to 2253 + 21 = 2274 station beam samples being blanked. Allowing for the variation described above, the expected range of station beam blanked is 2272-2274.
Step-Response Analysis
The RFI detection algorithm implemented in firmware is explained in detail at RFI Detection Module Documentation. In order to determine the number of RFI frames that will be blanked in test case # 2, we need to do a step response analysis for long-term and short-term averages.
When a step function of constant amplitude A is applied as the ADC input, the the corresponding instantaneous power is:
Long-Term Accumulator
The firmware module calculates the running long-term sum at every time sample:
where
The long-term cumulative sum equation matches the first-order IIR filter form:
where
and
Step Response From the IIR Form
According to the first-order IIR derivation from this source at UC Santa Barbara, the step response is
Applying this to the accumulator and substituting the values of \(a_1\) and \(b_0\) gives
Long-Term Average
The long-term average is computed in the RFI detection module as
Short-Term Average
The short-term average integrates over 2 * 216 = 432 samples,
which yields a constant value after the step:
Solving for Convergence
RFI is asserted when the short-term average power exceeds the long-term average power times the RFI factor. The number of samples it takes for RFI to be deasserted after the step is determined by solving for the convergence:
Substitution produces
leading to
Cancelling \(4A^{2}\) and taking log on both sides:
Solving for n:
Substituting \(a_1\) and evaluating:
Since each ADC frame contains 216 time-multiplexed samples, the corresponding ‘RFI counts’ in terms of frames is given by:
Thus, the long-term average rises up and meets the short-term average at approximately 2253 frames after the step and the RFI flag gets deasserted after this.
The plot below shows how the long-term and short-term average change in response to a step input applied at frame 4097. The convergence occurs at frame 6349.