Testing SKAMPI
This page outlines the various testing approaches to perform on the artifacts (e.g. SKA Mid and SKA Low) produced from SKAMPI.
Attention
Any purported capability, feature or characteristic, claimed to exist on the deliverable artifacts must be “backed up” by objective tests passing when executed on the artifacts
Therefore the primary aim of tests on SKAMPI is to describe the current characteristics of the artifacts delivered from a particular version of SKAMPI.
SKAMPI should be seen as a testing facility where the final stage of developed software is run before delivery and connection with real telescope hardware. At this stage the deliverables should be seen as fully fledged systems (software running on integrated platformed servers) capable of delivering end-to-end value to users. All the tests that are included with SKAMPI are therefore executed with the objective of verifying and validating end to end capability.
The intended stakeholders of these tests are:
AIV engineers, who may want to see what tests are there, may want to write new tests, may want to be able to run them, may want to see existing test results.
Developers, who may want to write new tests, to debug them and to run them.
Program managers, who may want to see what tests are there and their results.
Test approaches
Testing of SKAMPI allows for probing tested systems from various different viewpoints in order to ensure an accurate understanding of its current state for different stakeholders. Supported tests include:
BDD tests: Behavioral tests performed in specific users/stakeholder domain language to explicitly demonstrate user value and to provide “Living Documentation”.
System tests: Tests that ensure correct behaviour, installation and configuration of software in their deployed environment (includes smoke tests, performance tests and other miscellaneous tests related to systemic issues/effects on the overall system).
Integration tests: Tests (BDD or system tests) that verify behaviour on a subset of components making up the system in order to assist diagnosing and/or facilitating a systematic approach to integrating subsystems.
Bugs: Tests that verify the existence of bugs/issues with software and eventually provide evidence of their resolution.
SKAMPI and the Systems-under-Test (SUTs)
Note
SKAMPI, as a configurable item, implies a single self standing entity, yet it produces one or more distinct artifacts for delivery to external stakeholders for a particular version of SKAMPI.
The software included in every version of SKAMPI consists of a software base with common parts resulting in the following deliverable artifacts:
SKA Mid
SKA Low
SKA Common/HQ (coming soon)
Therefore a test to be executed on SKAMPI has to refer to different distinct systems under test.
Assembling and deploying a SKAMPI SUT
The procedure to build and install a particular SUT from SKAMPI depends on the target environment type in which the SUT will run. Each target environment type in turn is determined by the particular intended use of the SUT.
Viewed as stages in a delivery pipeline, the intended target environment types are defined as follows (ordered from downstream to upstream stages):
On site Integration: A version deployed on a particular site that includes actual telescope hardware (or hardware prototypes) to perform site integration tests.
Staging: A fixed version released at particular points in time (mostly at the end of every PI sprint), made accessible via a set of web URLs for users wanting to demonstrate or explore current delivered value.
Pipeline Testing: A version automatically deployed as a result of a new commit on a branch of SKAMPI in order to run the predefined continuous integration tests.
Integration Testing: A platform exactly the same as for staging in which the user has manual control over the version of SKAMPI and the instantiation of it’s deliverables so as to test during development of new features
Development: A miscellaneous set of platforms (e.g. K8 minikube, K3) with separate self standing clusters that allows a developer to simulate the target environment in order to have close control over the composition and life cycle of SKAMPI parts during development
Refer to Environments for a more detailed description and listing of the current instances of environment types.
Users of SKAMPI can therefore choose, based on their particular use case, which intended environment fits their needs best. The intended environments involve deploying SKAMPI either automatically or manually.
Automatic Deployment and Testing
This is for pipeline testing in which the gitlab CI configuration takes care of deploying and running the SKAMPI artifacts for you, after which it will start testing jobs. See https://gitlab.com/ska-telescope/skampi/-/pipelines.
Pipelines can be initiated manually by any user with appropriate permissions and can configure the kind of jobs to be executed during each of the pipeline stages. Currently pipelines only run on “Pipeline Testing” environment types but in future this may also include the running of tests on staging.
Note
In future, pipelines may also be configured to run only a specific set of tests selected by the user. Pipelines may also be set to run on staging environment.
Manual Deployment and Testing
Manual deployment and testing is for cases where the user needs to explicitly control the life cycle of SUT. One reason for needing to control the life cycle of the SUT is when the developer is actively working on the SUT itself and need to re instantiate it after changes. Another reason is for when tests themselves have put the SUT in such a state that the only way to fix it is to redeploy it.
The technologies used for deploying the SUT allows the user to upgrade an installation, in which only those artifacts that have changed are redeployed with the option to rollback an upgrade if need be.
Refer to Deployment for detailed installation instructions.
FAQs about deployment and testing SKAMPI
How do I configure and assemble/bundle things together in order to form my system under test?
SKAMPI artifacts are installed into a Kubernetes platform using Helm as the configuration manager. Helm does the same that a package manager will do for software packages (e.g. npm, pip, apt etc) except that the packages are now running applications.
Helm calls the configuration data for these applications charts and the developer defines these charts as a set of manifest files plus dependent charts that make up the entire application.
The developer also provides a configuration file (called values) that can be edited by the user installing the chart. The “values” file provides the user with a set of options, each with a predefined default value as to how he wants the particular chart to behave and even be composed off. The user therefore is exposed a set of options allowing him or her to specify the behaviour as well as composition of the SUT, should he/she wish to deviate from the default settings provided.
SKAMPI however makes use of a makefile encapsulating and wrapping particular uses cases as makefile targets so as to provide a user friendly facade for calling helm commands. Refer to Deployment for a detailed explanation of how to use the makefile.
Where do I find the different components and their version numbers specifying how an SUT is made up?
The definition of each chart delivering the application can be found under charts/ folder with each artifact having a separately named sub folder. For example see https://gitlab.com/ska-telescope/skampi/-/tree/master/charts/skalow. The subfolder contains the definition of the actual intended application, specified by two files:
Chart.yaml: Which contains the version of the artifact (chart version) and the sub component charts (with version nrs) that it is composed of.
Values.yaml: Which contains the available options with default values determining how the chart and sub charts will be realized.
Note
The actual deployment of a chart is determined by the set of options supplied to HELM during the installation call, which may be different from the default ones provided by the chart. The options that differ from the default are provided in a separate values file referenced by the particular makefile target as a given env value. SKAMPI provides two value files that can be used for this: values.yaml and pipeline.yaml; each one intended for deploying in development environment and pipeline testing respectively; but a user is free to make up his own values file and point the env value to that file. Staging environment shall always use the default options.
Where do I find those responsible for delivering the subcharts making up the SUT’s?
Each chart comes with a description providing information about its provenience and links to ownership. To describe a particular chart run the following:
helm show chart ska/<chart_name>
Where does the SUT run, how is it contained, and how does it differ from where the deployment commands are run?
Where the SUT is deployed is determined by which intended environment type is being used. For each instance of an environment a set of credentials are provided allowing a client (running on a separate or same environment) to operate the running software.
For example if you are using a development environment on your local laptop using minikube, you will use your client software (helm and kubectl) to control the orchestration of the running software on your own machine. If the environment is “integration testing”, then your client software will have credentials to access a specific environment within a remote cluster in which the artifacts will get deployed.
The underlying platform upon which you install your artifacts (Kubernetes) provides the user with distinct namespaces in which you can install the artifacts. A namespace ensures isolation of software systems whilst running on the same server cluster by means of isolating address spaces.
Note
A particular namespace can run only one instance of an SUT. But an SUT may however distribute parts of it across more than one namespace (for example SDP chart has its own dedicated namespace for deploying workflow jobs)
The actual name of the namespace in which you are intending to deploy the SUT is specified as a helm chart value.
Where do the tests actually run?
In order for tests to communicate with the SUT they have only two options for interfacing:
Public API: An HTTP interface with a predefined hostname available for external components over a LAN interface.
Internal API: Internal TCP based interfaces that make use of addresses within a particular kubernetes namespace.
Todo
not clear to me (GB) how one would go in defining the hostname (and port?) to access a public API? do we have an example? GLR - see updates below
Internal API example
Tango framework: The tango library makes use of an env variable that contains the TCP host address and port nr denoting the tango “facility” in which the client should operate in. This address points in essence to a database that maintains addresses for all tango related components (device) taking part in the particular environment. Each device is allocated a unique domain name that a client can use to connect with. The example below illustrates the concept:
# export TANGO_HOST='databaseds-tango-base-test:10000'
from tango import DeviceProxy

device_under_test = DeviceProxy("sys/tg_test/1")
device_under_test.ping()
Note since the communications are internally, the client must be running as kubernetes resources that have access the kube namespace.
Internal API example
kubernetes framework: The kubernetes server API can also be accessed withing python code using a thinly wrapped library. If your environment variables are set correctly and the pod have been given the correct permissions then the same REST commands one could do using the command line tool ‘kubectl’ can be done using the API. Below is an example:
from kubernetes import config, client

config.load_incluster_config()
v1 = client.CoreV1Api()
pods = v1.list_namespaced_pod('test-mvp').items
The kubernetes server can be used both internally or externally dependent on the particular credentials set up in the env for that process.
public tango API:
There also exists an external REST API for tango. This interface is enabled by ensuring the REST components are deployed as part of SKAMPI install (they are by defualt):
tango-base:
    tangorest:
        enabled: true
If the test services are enabled, a host identified by the name tango.rest.mvptest.engageska-portugal.pt:80 can be accessed from an external REST client.
curl tango.rest.mvptest.engageska-portugal.pt
There does not currently exists an client library in tango for accessing the REST API.
For automatic tests during continuous integration this is achieved by firstly deploying a separate Kubernetes Pod (self contained process in Kubernetes), then copying the test files onto that pod, and finally running them on the pod. This can be manually done by calling the following:
make k8s_test
A user, who during development may want to run a specific test from his own IDE with the ability to perform debugging, will need to ensure the execution environment of its IDE is attached to a Kubernetes pod running in the same namespace as the SUT.
Refer to Working with VSCode for an example of doing this with VSCode.
What interfaces (human or programmable) are available and can be used for testing?
Interfaces can be grouped into (1) those belonging to the environment in which SKAMPI artifacts are deployed, (2) those provide by test artifacts needed to run tests in, and (3) those that are part of the SUT itself.
Interfaces of the environment
They consist of the client software (helm and kubectl) that the user can use to perform life cycle actions on the applications. In addition the user can also make use of logging systems connected externally to the environment to assist in investigating faults:
Kibana: Gathers logs from all components running on remote cluster
EDA: Gathers state of artifacts running on cluster (coming soon)
Todo
can we provide some example of actual use of these interfaces?
Interfaces of the artifacts
Todo
what are these artifacts? the PODs?
They consist of the means for controlling the execution of tests on the deployed testing artifacts. When tests are run using make k8s_test this happens under the hood and a user does not have the means to intervene.
During development testing, provided a user has means to attach to the testing artifact (e.g. testing pod), a user have full control over the initiating of tests and their life cycle.
Todo
how about using environment variables as a mechanism to send values to the tests?
Not clear to me (GB) how a user will have ‘full control’. would a user be able to run pytest commands with its own set of options and arguments?
Interfaces of the SUTs
They consist of the interfaces that are part of the actual SUT and may include both of programmable as well as user (graphical or command-line) interfaces.
For a detail description of the functionality of the SUT interfaces refer to documentation of the actual chart artifact being used.
The current main interfaces are listed here:
Webjive: provides a engineering UI interface with the ability to create your own customized GUIs
TANGO VNC: provides a set of desktop GUIs over web browser in order to interfaces with tango based components
OET scripts: provides a command line console for running observation scripts.
Note
OET scripts includes a jupyter console that provides an interactive python over web browser in which commands can be called that access internal APIs. This gives the user the ability to perform commands on internal components for exploration purposes.
Common Tools and Dependencies
Todo
we might want to move some of this material to the Deployment page.
Accessing the SUTs in staging environment and or pipeline testing can all be done over a web browser. However the domain names to access the SUT may not have static public IPs. A user can still access these URLs if he/she has access to the SKA OpenVPN. Then he/she needs to update their /etc/hosts file as follows:
192.168.93.102 <hostname>
where <hostname> is ????? and the IP number is ?????
For development and integration test environments the user needs to have a client machine running Linux os either directly or as a VM. The client machine can either be a local laptop or a remote machine running an ssh server. If the client intends to deploy on the remote cluster the machine also needs to be logged into the SKA OpenVPN LAN.
Note
Credentials for access to SKA VPN and or remote Kubernetes clusters can be requested from the System team.
The client needs to have at least Kubectl and Helm rev 3 installed with credentials supplied into a kubeconfig file that ensures access to the intended cluster namespace.
Developers are free to choose their own IDE or text editor but VScode is recommended due to its particular set of free tools for working in kubernetes and remote ssh environments. PyCharm can also be used as long as developers manage the extensions for connecting to kubernetes environments themselves.
Such “telepresence tools” are useful in cases where a developer wants to inject his/her local environment into a kubernetes cluster (provided he or she has credentials set up).
All tests are done using pytest framework, with BDD Gherkin tests implemented using the pytest-bdd plugin.
Lastly, SKAMPI tests can make use of various helper files, fixtures and test charts as part of the SKA testing runway repository. In particular, developers may use the skallop testing library that helps users writes test working with asynchronous events and managing the state of SUT.
Typical scenarios
1 Testing a new feature
I want to verify that a new feature works on the integrated SKAMPI artifacts
To enact such a scenario a developer makes the required changes to charts in question needed to realise the functionality. This may involve separating the work and testing sub functionalities first which may require a development environment for deploying the chart as a stand alone system. NOT CLEAR TO ME (gb)
The developer may also opt to deploy the entire SKAMPI artifacts in an integration environment but limiting the composition of the chart to only those under investigation. This can be done by setting options to non default values in a separate values file and letting the makefile target this file.
In tandem with changing and updating the SUT, the developer also create, change and update test for verifying behaviour. The developer will need to choose a mechanism for running tests in the chosen environment.
These tests might be formulated as BDD tests to verify the intended feature, or simply as pytest scripts.
If and when the developer is satisfied with a particular change and has verified that the changes do not cause failures on that branch, he or she can push the changes to the remote branch and check that the subsequent pipeline does not result in test failures.
Note that this process may occur recursively in a similar fashion on work inside lower level charts. In order to ensure changes are pulled continuously, developers should work in changes from lower level charts into SKAMPI as often as possible.
Once a particular feature test passes, the merge request can be started. When approved and code can be merged into the master branch upon which the tests will be verified again to be passing on the master pipeline. At the end of the sprint the merged feature will form part of the released SUT on SKAMPI that can be run on staging which the developer can use to demonstrate to relevant stakeholders.
2 Testing a bug
I want investigate a potential bug on the SKAMPI
If a potential issue was raised indicating a possible bug, in general the user would want to be able to do two types of things on SKAMPI:
to replicate the fault condition to the extend that the input steps can be exactly specified to consistently reproduce the condition. Or
To change the input steps and artifact composition until the failure is not present. The required changes in steps and or composition will then be used to allocate failure responsibility.
In more specific terms the investigator may need to create a new test (if the failure was detected by means of demonstration only). This requires deployment in either a development or integration test environment.
Depending on the nature of the test, an investigator may need to be able to observe specific states of the SUT and look for error/inconsistent values. This requires log gathering tools that allows filtering information according to specific patterns. The log gathering can either be those provided by the cluster itself or those used by tests using the skallop library.
Todo
can we provide links to info to logging tools or skallop?
Using the knowledge gained from observing the state, the investigator can now experiment with changing the test and or composition of SUT and look for changes in state. At some point the analysis may get to the point where the fault is known to the extend that the required changes can either be made immediately or specified exactly.
3 Understanding functionality
I want to understand the current functionality of SKAMPI artifacts
The best way to understand the system is to attempt to perform operational tasks on it. The user will attempt to achieve certain jobs (e.g. assign resources to a sub array) by following roughly the documentation provided by that application. The best environment to perform this is the staging environment using the provided WebJive GUIs.
4 Integration testing
I want to perform a particular integration test between two particular subsystems on SKAMPI
The user would want to be able to have exact control over the configuration (VALUES) file and the life cycle commands of the SUT (install, upgrade, uninstall, re-install). In essence the integration test consists of updating the versions of the two sub charts needed to interact in the integration test. A specific test may need to be written taking into account dependencies on systems that fall outside the system under test. The integration test environment is ideally suited for these types of tests.
5 New system tests
I want to develop new or refactor old tests that verifies existing functionality of SKAMPI
Here the user is not too much concerned with updating the SUT and thus needs not even have to use SKAMPI makefile targets to send life cycle commands for the SUT. However, errors in tests may often lead to failing the SUT in such a way that re-deployment is the only way forward. The user would also prefer to have an IDE attached to a kubernetes resource running in the cluster so that he can have access to debug services whilst executing commands on the SUT. The integration and development environments are ideally suited for these kind of tasks.
The life-cycle of tests
The nature and purpose of tests changes according to how the maturity of the system evolves for a given set of functionalities. In addition the maturity of the test itself and the platform and artifacts used by the tests also change over the course of time.
The first items that needs to mature are the testing packages (3d party as well as local) used by testing code. Even though changes to these items evolves continuously, their usages in tests are limited in number until they have reached a certain amount of stability. For example the skallop library is being introduced at a relatively slow pace into existing tests to ensure the maturity is higher than the test itself using it.
The next items that matures are the tests themselves. Their growth in maturity should always precede that of the the SUT, even though both follow each other in a close manner. This is because tests are often tightly coupled with functionality in order to pick up regression failures, requiring constant changes in order to be in sync with updated functionality. Thus in the beginning there is a relatively high likelihood of failures being false positives, especially since the needed SUT functionality upon which tests can be validated may not even exist in the beginning. For this reason it is desired for tests to be as simple as possible, relying on underlying stable testing infrastructure for performing the complex parts of the routines.
After tests become more stable in outcomes, the focus shifts towards functionality of the SUT. In the early growth stages of a certain set of functionalities, tests are often required to focus on the technical details of how they are realized; verifying the basic usage of technologies is correct. As these tests pass more consistently, the focus shifts towards end user behaviour, becoming more high level in their description over time. The usefulness of technology focused tests diminishes, often being removed in order to prevent false positives caused by changes in functionalities.
However, during this stage certain latent defects in the SUT may start to emerge due to
tests becoming more accurate, revealing previously hidden defects, and
probability of certain permutations of configuration factors occurring more likely over time. This may require specialized type of tests and environments to ensure test failures can be replicated and the underlying conditions observed more closely.
During the mature stage of the SUT for a particular set of functionalities, the value of having low level technical tests becomes less and less and may be retired; alternatively they may become less tightly coupled to the SUT so as to prevent false positives.
During the final stages of a given set of SUT functionalities, the reverse starts to happen as features become deprecated and technologies become obsolete, causing an increase in reported failures. Certain tests will then need to be purposefully retired in accordance with the deprecation of features and changes in technologies. These changes may not always happen seamlessly and require some work in figuring out relationships between tests and retired functionality. It is for this reason that some form of traceability be maintained between tests and specific features and abilities of the system. Another useful metric in assisting change management of obsolescence is to track the amount of references made to certain low level services in use by higher level systems intending to deliver end user value. Services and parts that are never used by systems delivering end to end failures are often prime candidates for being deprecated.
Todo
GB is not 100% in agreement with the previous paragraph. I’m not sure that this really happens. If we do regular maintenance of the SUT and its tests, then false positives should be kept low all the time, regardless of how old are the used technologies
We should also say where are we at the current moment
Existing tests
Existing BDD tests
Behaviour-Driven Development is an approach to the development of software that is based on tests that specify the expected behaviour of the SUT. These tests are based on concrete examples and are often expressed in the Gherkin language. The steps in these test scenarios need to be automated by using appropriate libraries or frameworks (for example in pytest).
Todo
Describe:
give an outline of the different kinds of BDD tests that there are
provide 1-2 examples
where the BDD tests are stored; put a link to the gitlab repo folder
put a link also to the code that automates them
Xray issues in XTP
Existing smoke tests
Todo
Describe here what other tests exists now
- provide links to where they are stored, at least some of them
see post-deployment/tests/smoke
Existing test results
Todo
Describe where to look for test execution reports
maybe gitlab pipelines/job
maybe xray test executions in jira (it should already be working - maybe with a bug in uploading failed tests)
How to run existing tests
Todo
Provide details on how to run CI pipelines, and how to specify appropriate details so that different tests can be choosen or different data can be choosen or different SUTs can be choosen Describe how to run them with pytest-bdd directly, or maybe with Make. Or maybe with jupyter.
which gitlab params can be used?
which other interfaces/tools can I use to run existing tests?
iPython
pycharm
vscode
explain how to configure them and how to run them
explain how to connect them to the SUT
explain how to run tests using them
can I select single tests?
can I select test sets?
are there constraints on tests?
some tests cannot be run together?
some tests cannot be run on certain SUTs?
some tests require some priviledge?
Data used by tests
Todo
describe here our approach to handling reference data or other test data that are used by tests
where are the data being stored?
how can they be used/referenced in test scripts?
See resources/test_data
- Reference data
These are data stored inside the SUT that are needed for the tests to run but that the tests themselves do not modify. For example, predefined user credentials could be examples of reference data, or predefined Subarray IDs.
- Test data
These are data that are used in test scripts and that are used to drive the SUT or to check its outputs. Test data can be changed by test scripts.
OLD STUFF
Note
this is the original content of this page. We should reuse anything of this if it useful.
Minikube Testing Environment - EngageSKA Openstack
Minikube is a tool that makes it easy to run Kubernetes locally. Minikube runs a single-node Kubernetes cluster inside a Virtual Machine (VM) in Openstack.
The first step is to create a Virtual Machine in EngageSKA Openstack: https://developerskatelescopeorg.readthedocs.io/en/latest/services/ait_performance_env.html. The recommended specifications are:
Volume Size: 100 GB
Image: Ubuntu 18.04 LTS Jan/2020
Flavor: m2.small
Don’t forget to associate your public key or generate a new key pair in the Key Pair section.
Next, go to the Instances section and create a new floating IP (dropdown on the right).
Install ansible inside the VM and run the ansible-playbooks for creating a development environment and the SHAMPI environment:
# Install Ansible
sudo apt-add-repository --yes --update ppa:ansible/ansible && sudo apt-get install ansible
# Create Environment
git clone https://gitlab.com/ska-telescope/ansible-playbooks.git
cd ansible-playbooks
ansible-playbook -i hosts deploy_tangoenv.yml
ansible-playbook -i hosts deploy_SKAMPI.yml
Verify if everything is running using kubectl get services -n integration:
NAME                               TYPE        CLUSTER-IP       EXTERNAL-IP   PORT(S)                             AGE
archiverdb-archiver-test           NodePort    10.96.233.41     <none>        3306:31305/TCP                      5m27s
databaseds-tango-base-test         NodePort    10.105.145.228   <none>        10000:30897/TCP                     5m24s
elastic-logging-test               NodePort    10.103.79.41     <none>        9200:31976/TCP                      5m26s
etcd-restore-operator              ClusterIP   10.100.7.96      <none>        19999/TCP                           5m28s
jupyter-oet-test                   NodePort    10.105.61.127    <none>        8888:32025/TCP                      5m26s
kibana-logging-integration-test    ClusterIP   10.102.79.54     <none>        5601/TCP                            5m26s
mongodb-webjive-test               ClusterIP   None             <none>        27017/TCP                           5m23s
rest-oet-test                      ClusterIP   None             <none>        5000/TCP                            5m25s
ssh-oet-test                       NodePort    10.97.46.250     <none>        22:30520/TCP                        5m25s
tango-rest-tango-base-test         NodePort    10.99.6.220      <none>        8080:32490/TCP                      5m24s
tangodb-tango-base-test            NodePort    10.103.4.193     <none>        3306:31154/TCP                      5m24s
test-sdp-prototype-etcd            ClusterIP   None             <none>        2379/TCP,2380/TCP                   3m18s
test-sdp-prototype-etcd-client     ClusterIP   10.107.155.120   <none>        2379/TCP                            3m18s
test-sdp-prototype-etcd-nodeport   NodePort    10.107.127.158   <none>        2379:30456/TCP                      5m25s
vnc-tango-base-test                NodePort    10.108.131.141   <none>        5920:30658/TCP,6081:30662/TCP       5m24s
vscode-tango-base-test             NodePort    10.107.133.184   <none>        22:31214/TCP                        5m24s
webjive-webjive-test               ClusterIP   10.111.102.81    <none>        80/TCP,5004/TCP,3012/TCP,8080/TCP   5m23s
The next step is to reboot the system with sudo reboot and then ssh again into the VM.
Finally, download the SKAMPI repository and run the test in minikube:
#Remove the existing SKAMPI directory
sudo rm -rd SKAMPI/
# Download and run test
git clone https://gitlab.com/ska-telescope/SKAMPI.git
cd ansible-playbooks
ansible-playbook deploy_minikube.yml
cd ..
cd SKAMPI/ make deploy_all KUBE_NAMESPACE=integration
Kubernetes Testing Environments
At the moment 3 k8s multi-node clusters are available for testing purpose:
Cluster name |
Information |
|---|---|
engageska-k8s-master |
|
engageska-k8s-v2 |
192.168.93.46 gangway.kubernetes-v2.engageska-portugal.pt
|
kubernetes-cipro |
192.168.93.46 gangway.kubernetes-cipro.engageska-portugal.pt
|
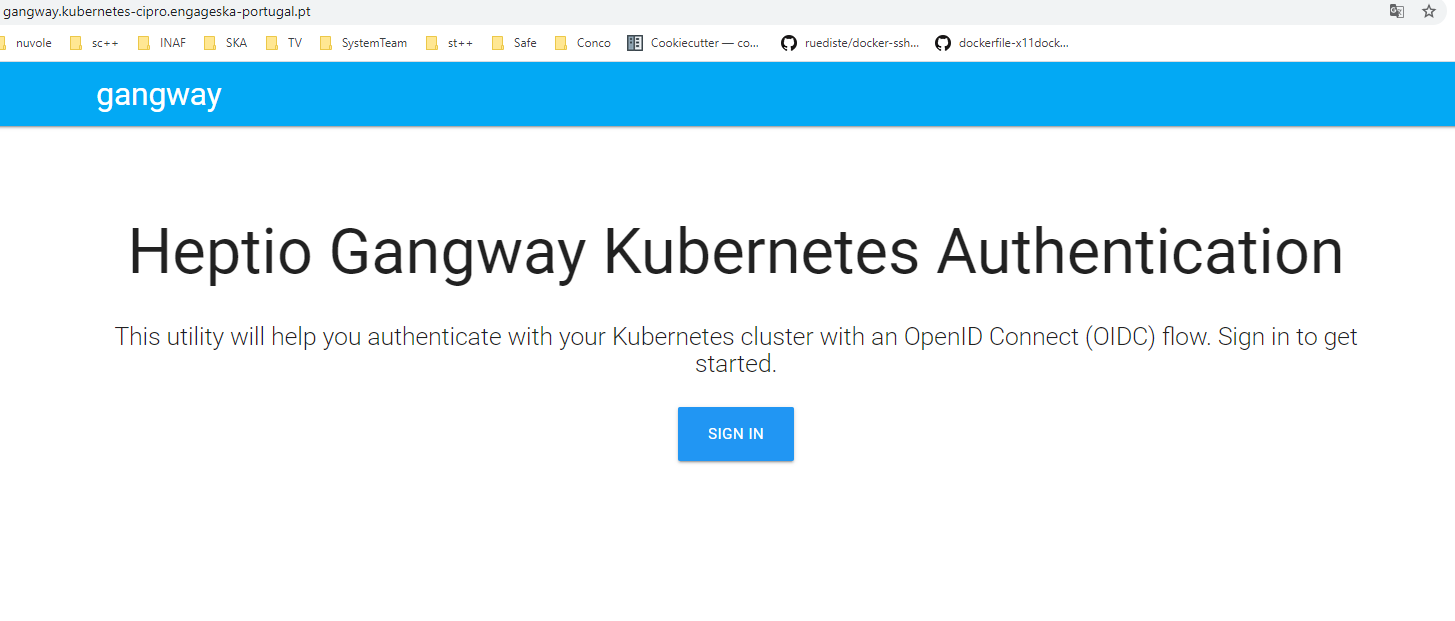
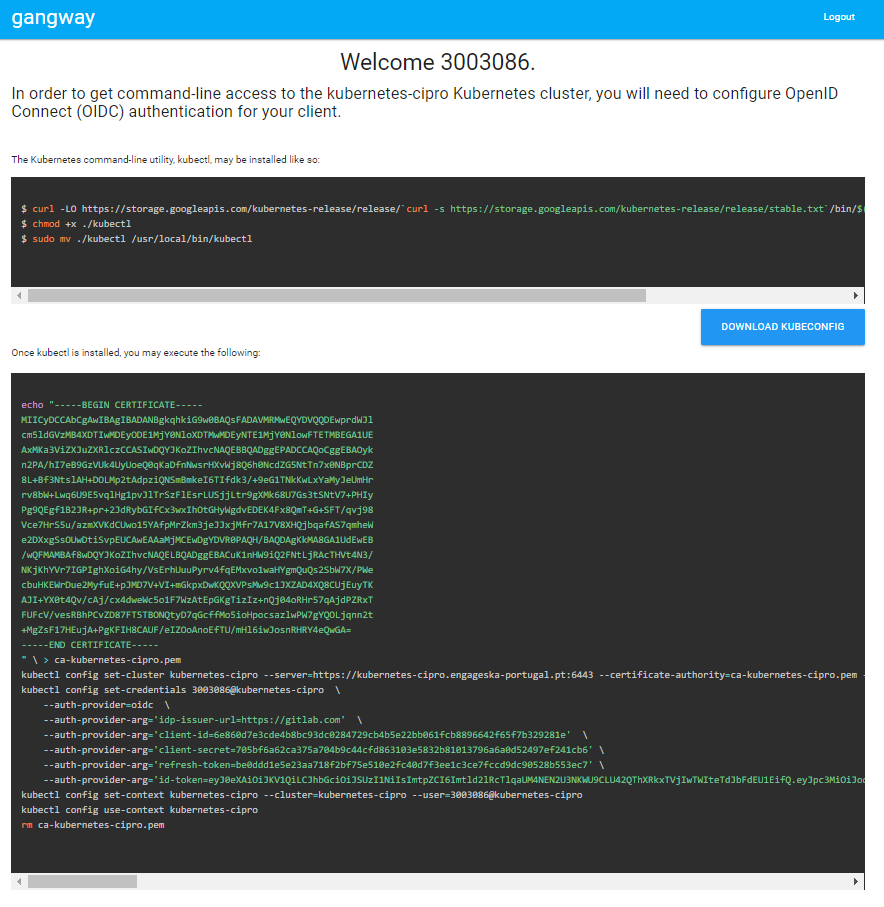
If a cluster has the A&A module enabled it is possible to generate the instructions to let the local kubectl work with it. In order To do that, once modified the file /etc/hosts as explained above, open the [gangway](https://github.com/heptiolabs/gangway) url for engageska-k8s-v2 or `kubernetes-cipro <http://gangway.kubernetes-cipro.engageska-portugal.pt >`_. The Sign In button will redirect to gitlab.com for authentication. Once authenticated it will appear the set of commands to setup the local kubectl as shown below.
The following namespaces are available for use: “integration”, “sdp”, “csp”, “button”, “ncra”, “karoo”. For creating new namespaces or for any authorization request, contact the system team.
Visual Studio Code Remote Access
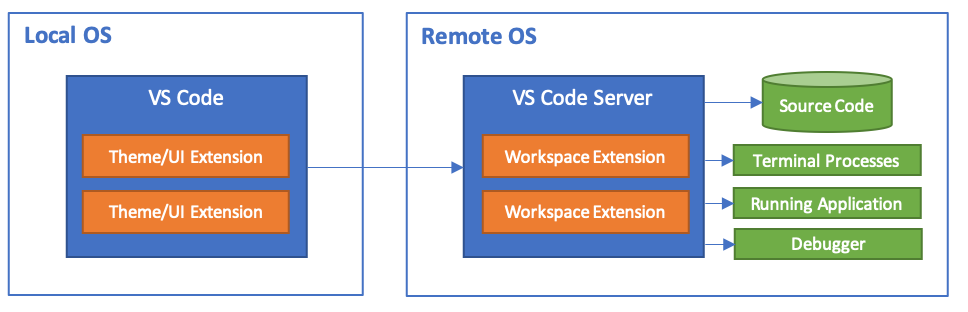
Visual Studio Code Remote Development allows you to use a container, remote machine, or the Windows Subsystem for Linux (WSL) as a full-featured development environment.
No source code needs to be on your local machine. Each extension in the Remote Development extension pack can run commands and other extensions directly inside a container, in WSL, or on a remote machine so that everything feels like it does when you run locally.
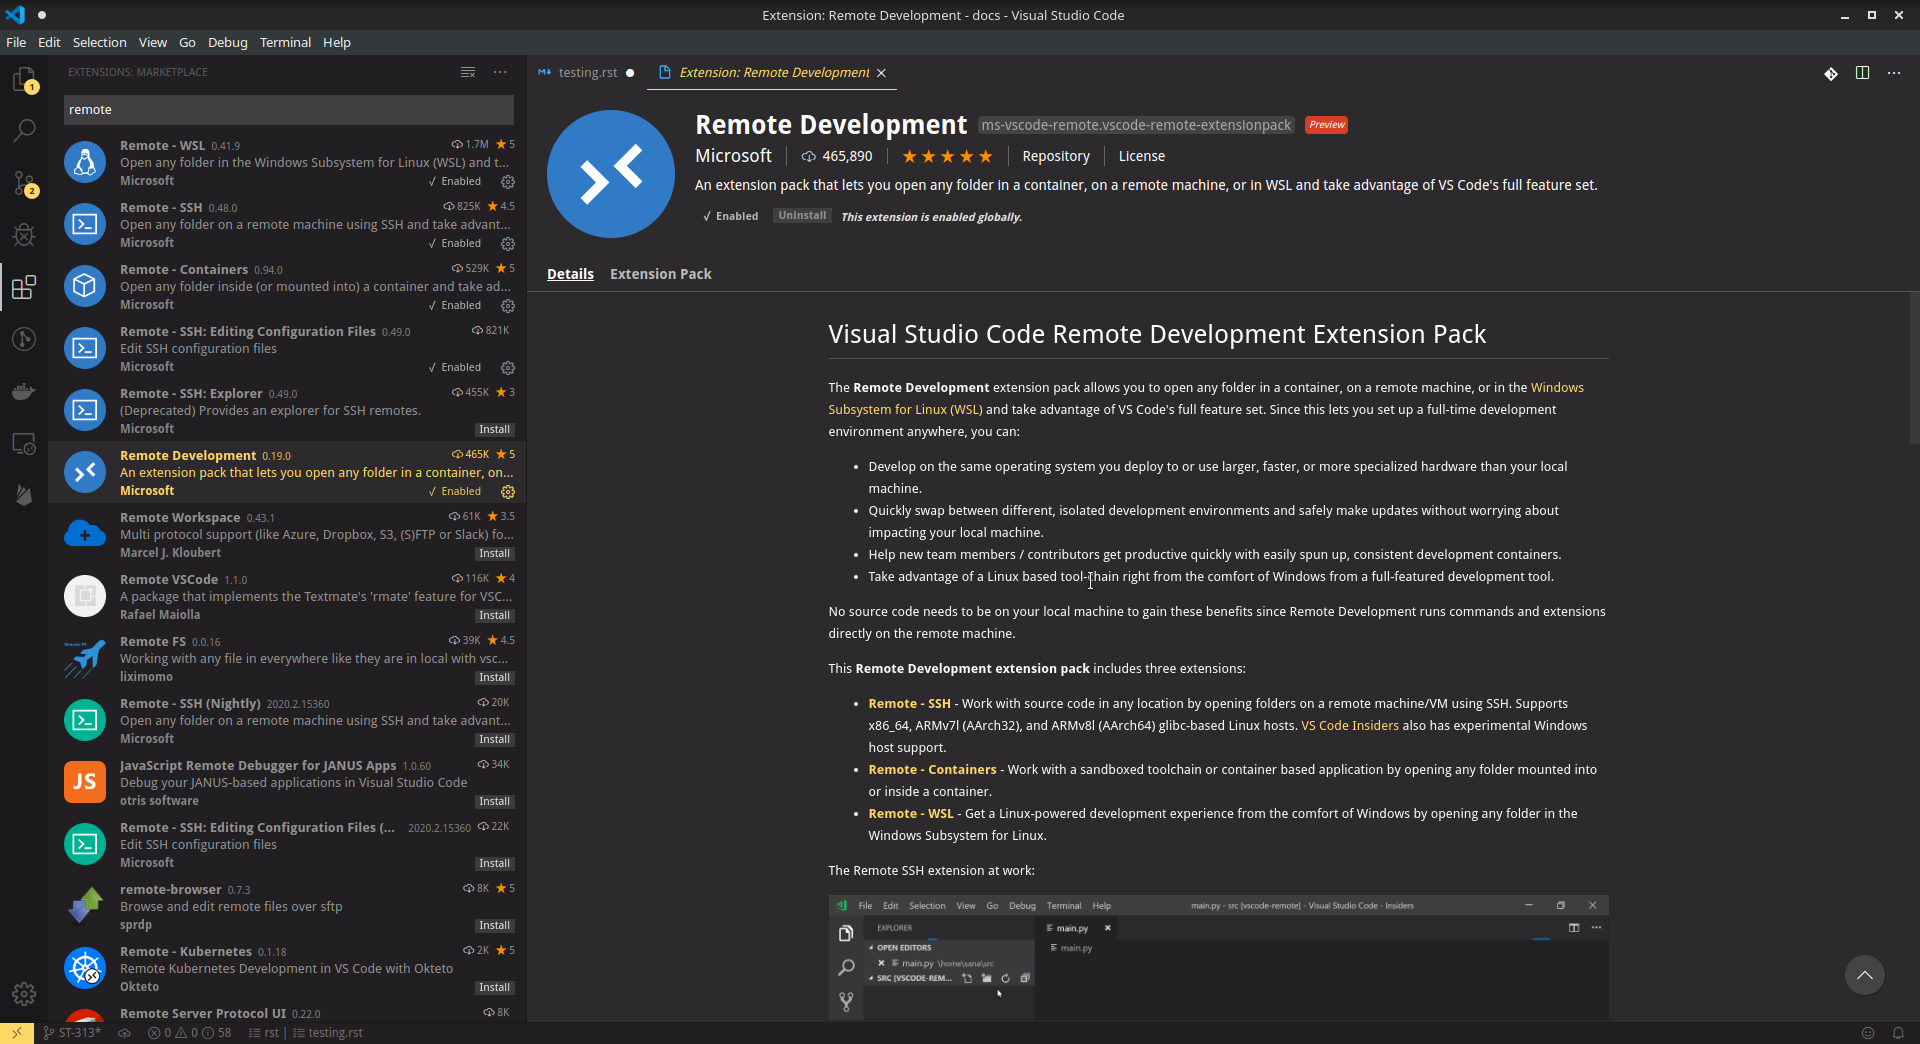
Before everything, we need to install the Remote Development extension from vscode.
On vscode, open the Remote-SSH: Open Configuration File..., copy and paste these properties:
Host connection-name         # connection-name -> name of your connection, give any name you want
    HostName IP              # IP -> VM's floating IP
    User ubuntu
Finally, with the command ssh connection-name starts the ssh connection.
After you created a new ssh connection on your local machine: `Create SSH connection`_.
After this, launch the remote extension inside vscode (bottom left icon or use the shortcut ctrl+shift+P)
and select Remote-SSH: Connect to Host... and select the connection-name you previously created.
The tango-base chart available in the SKAMPI repository defines an ssh service which can be used within the vscode extension. The service is deployed in the same IP as the host machine and the port can be discovered with the command kubectl get services -n integration which will give you the following output:
kubectl get services -n integration
NAME                               TYPE        CLUSTER-IP       EXTERNAL-IP   PORT(S)                             AGE
...
vscode-tango-base-test             NodePort    10.107.133.184   <none>        22:*PORT*/TCP                        5m24s
...
Create new ssh connection on your local machine: `Create SSH connection`_. But with this configuration parameters:
Host connection-name          # connection_name -> name of your connection, give any name you want
    HostName IP               # IP -> VM's floating IP
    Port port                 # port-> vscode server port
    User tango
After this, launch the remote extension inside vscode (bottom left icon or use the shortcut ctrl+shift+P)
and select Remote-SSH: Connect to Host... and select the connection-name you previously created.
Please request the password to the system team.
Testing Infrastructure as Code
There is a substantial amount of infrastructure and its constituent parts (e.g. Kubernetes resources and their configuration) that forms part of The Telescope. This configuration is orthogonal to the functionality of the software components that are deployed, but changes to them can result in faults in deployment and operation of the system.
Testing at the appropriate level will ensure faster feedback of changes, reducing frustration for everyone and ultimately improve the quality of the system. Troubleshooting faults in a distributed system caused by a typo in configuration is no fun!
To support different levels of testing, various different jobs are executed as part of the SKAMPI build pipeline and some testware has been developed to aid in testing.
The stages of the pipeline related to testing are outlined below:
Stage |
Description |
|---|---|
Static_analysis |
Tests aspects of charts that do not require their deployment, e.g. linting |
Unit_test [unit] |
Tests here might deploy them to an ephemeral test environment. |
Test |
Tests to be executed in-cluster alongside the fully deployed SKAMPI prototype. |
SKAMPI Gitlab CI Pipeline (as of January 2020):
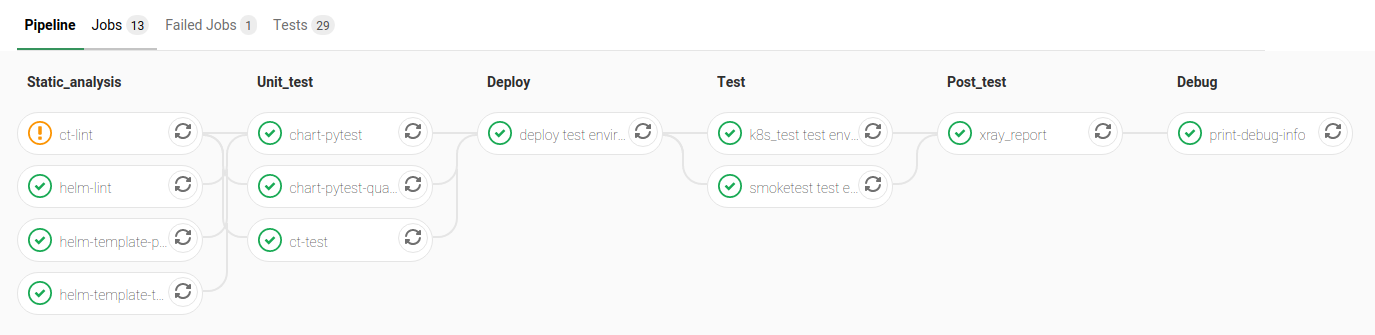
Some components have been developed to assist in testing the Helm charts using Python. They are intended to be used with pytest as a test runner and there are currently three jobs in the pipeline that are configured to executed them, filtered based on pytest markers:
helm-template-pytest runs as part of the Static_analysis stage in the pipeline executes Python tests marked with
no_deploy.chart-pytest runs as part of the Unit_test stage and will execute tests marked with the
chart_deploymarker [unit].chart-pytest-quarantine also runs during the Unit_test stage and executes tests marked with
quarantinebut do not fail the build if they do.
As per convention, Pytest is will collect all tests placed in the /tests/ directory. The following markers are
currently defined (see /pytest.ini for more details):
no_deployIndicates tests that will not require any resources to be deployed into a cluster. Generally, tests that parse and transform the source chart templates.
chart_deployIndicates tests that requires resources to be deployed into cluster such as the Helm chart under test and any other collaborating testware.
quarantineIndicates tests that should be executed but not necessarily break the build. Should be used sparingly.
The following custom command-line flags can be passed to Pytest:
--test-namespace <namespace>Specify the namespace to use in the test session. Defaults to
ci.--use-tiller-pluginIndicates that all commands to Helm should be prefixed with
helm tiller run --. Required when using the helm-tiller plugin.
The lifecycle (setup, execute, teardown) of tests are managed by pytest fixtures, defined in /tests/conftest.py.
The infratest_context fixture in particular will determine if tests that involve deployments are included in the
pytest run, i.e. the chart_deploy marker is included. It will then:
invoke kubectl to create a namespace for the test resources(pods, services, etc.) to be deployed into
ensure this namespace is deleted after the test run
Note: the default namespace is ci, but can be overriden by specifying the custom pytest option,
--test-namespace. When running inside the pipeline, this flag is set to ci-$CI_JOB_ID so each job will use
its own namespace and resources, ensuring test isolation.
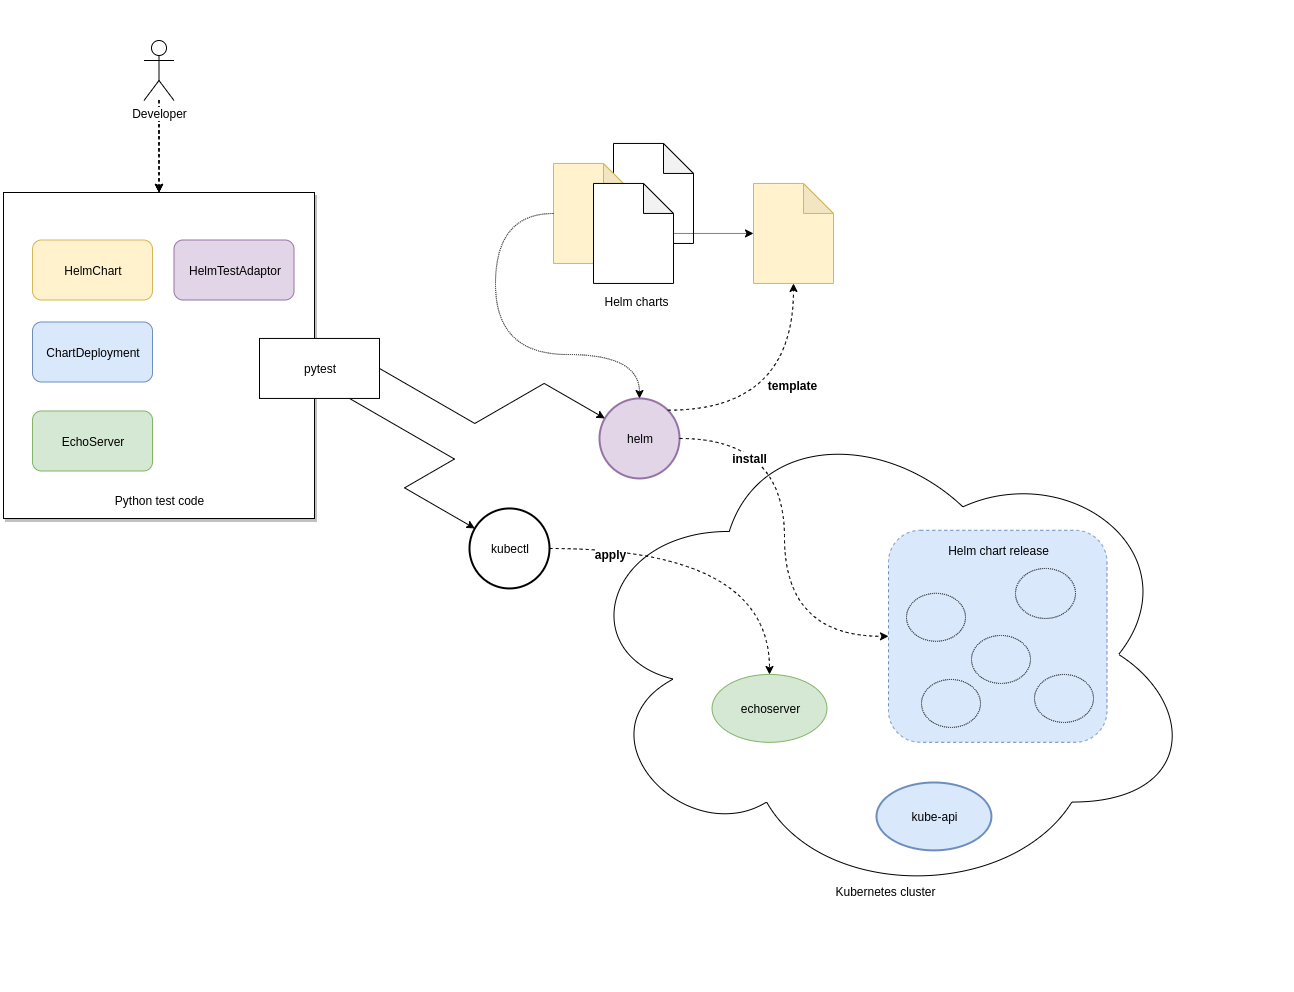
A collection of useful components and functions to assist in testing can be found in the tests.testsupport module
(/tests/testsupport/):
testsupport.utilFunctions that may be useful in testing such as wait_until which allows polling, retries and timeouts.
testsupport.helm.HelmChartRepresents a Helm chart that is the collection of YAML template files and not necessarily a set of deployed Kubernetes resources. Primarily used to assist in testing the policies in YAML specifications, i.e.
no_deploytests.testsupport.helm.ChartDeploymentRepresents a deployed Helm chart and offers access to its resources in-cluster their metadata (by querying the Kubernetes API server).
testsupport.helm.HelmTestAdaptorA rudimentary adaptor class to manage the interaction with the Helm CLI.
testsupport.extras.EchoServerRepresents a pod that can be deployed alongside the chart under test, containing a basic Python HTTP server that can receive commands. Currently it only supports echoing any HTTP POST sent to the /echo path. A handle to this is provided by the print_to_stdout method.
Charts are deployed via Helm and the HelmTestAdaptor. It’s available as a Pytest fixture or you can import it from
the tests.testsupport.helm module.
The ChartDeployment class is an abstraction to represent a deployed chart and offers access to its resources
in-cluster (by querying the Kubernetes API) and metadata (such as release_name).
In fact, instantiating a ChartDeployment in code will deploy the specified chart. A useful pattern is to create
Pytest fixture that represents the chart to be deployed and yields a ChartDeployment object. It can also call
.delete() to ensure the chart is deleted and Pytest fixture scope can be used to limit a chart’s lifespan. For an
example of this see the tango_base_release fixture in /tests/tango_base_chart_test.py.
The diagram below illustrates the relationship between the Python classes in test code, CLI tools and the cluster.
Requirements:
A Kubernetes cluster (minikube).
kubectl authorized to create namespaces and deploy resources to the cluster.
helm v3.0.2
Python 3.7+
Install Python dependencies:
pip install -r test-requirements.txtExecute only the
no_deploytests:pytest -m "no_deploy and not quarantine"Execute only the
chart_deploytests:pytest -m "chart_deploy and not quarantine"Execute the quarantined tests:
pytest -m quarantine
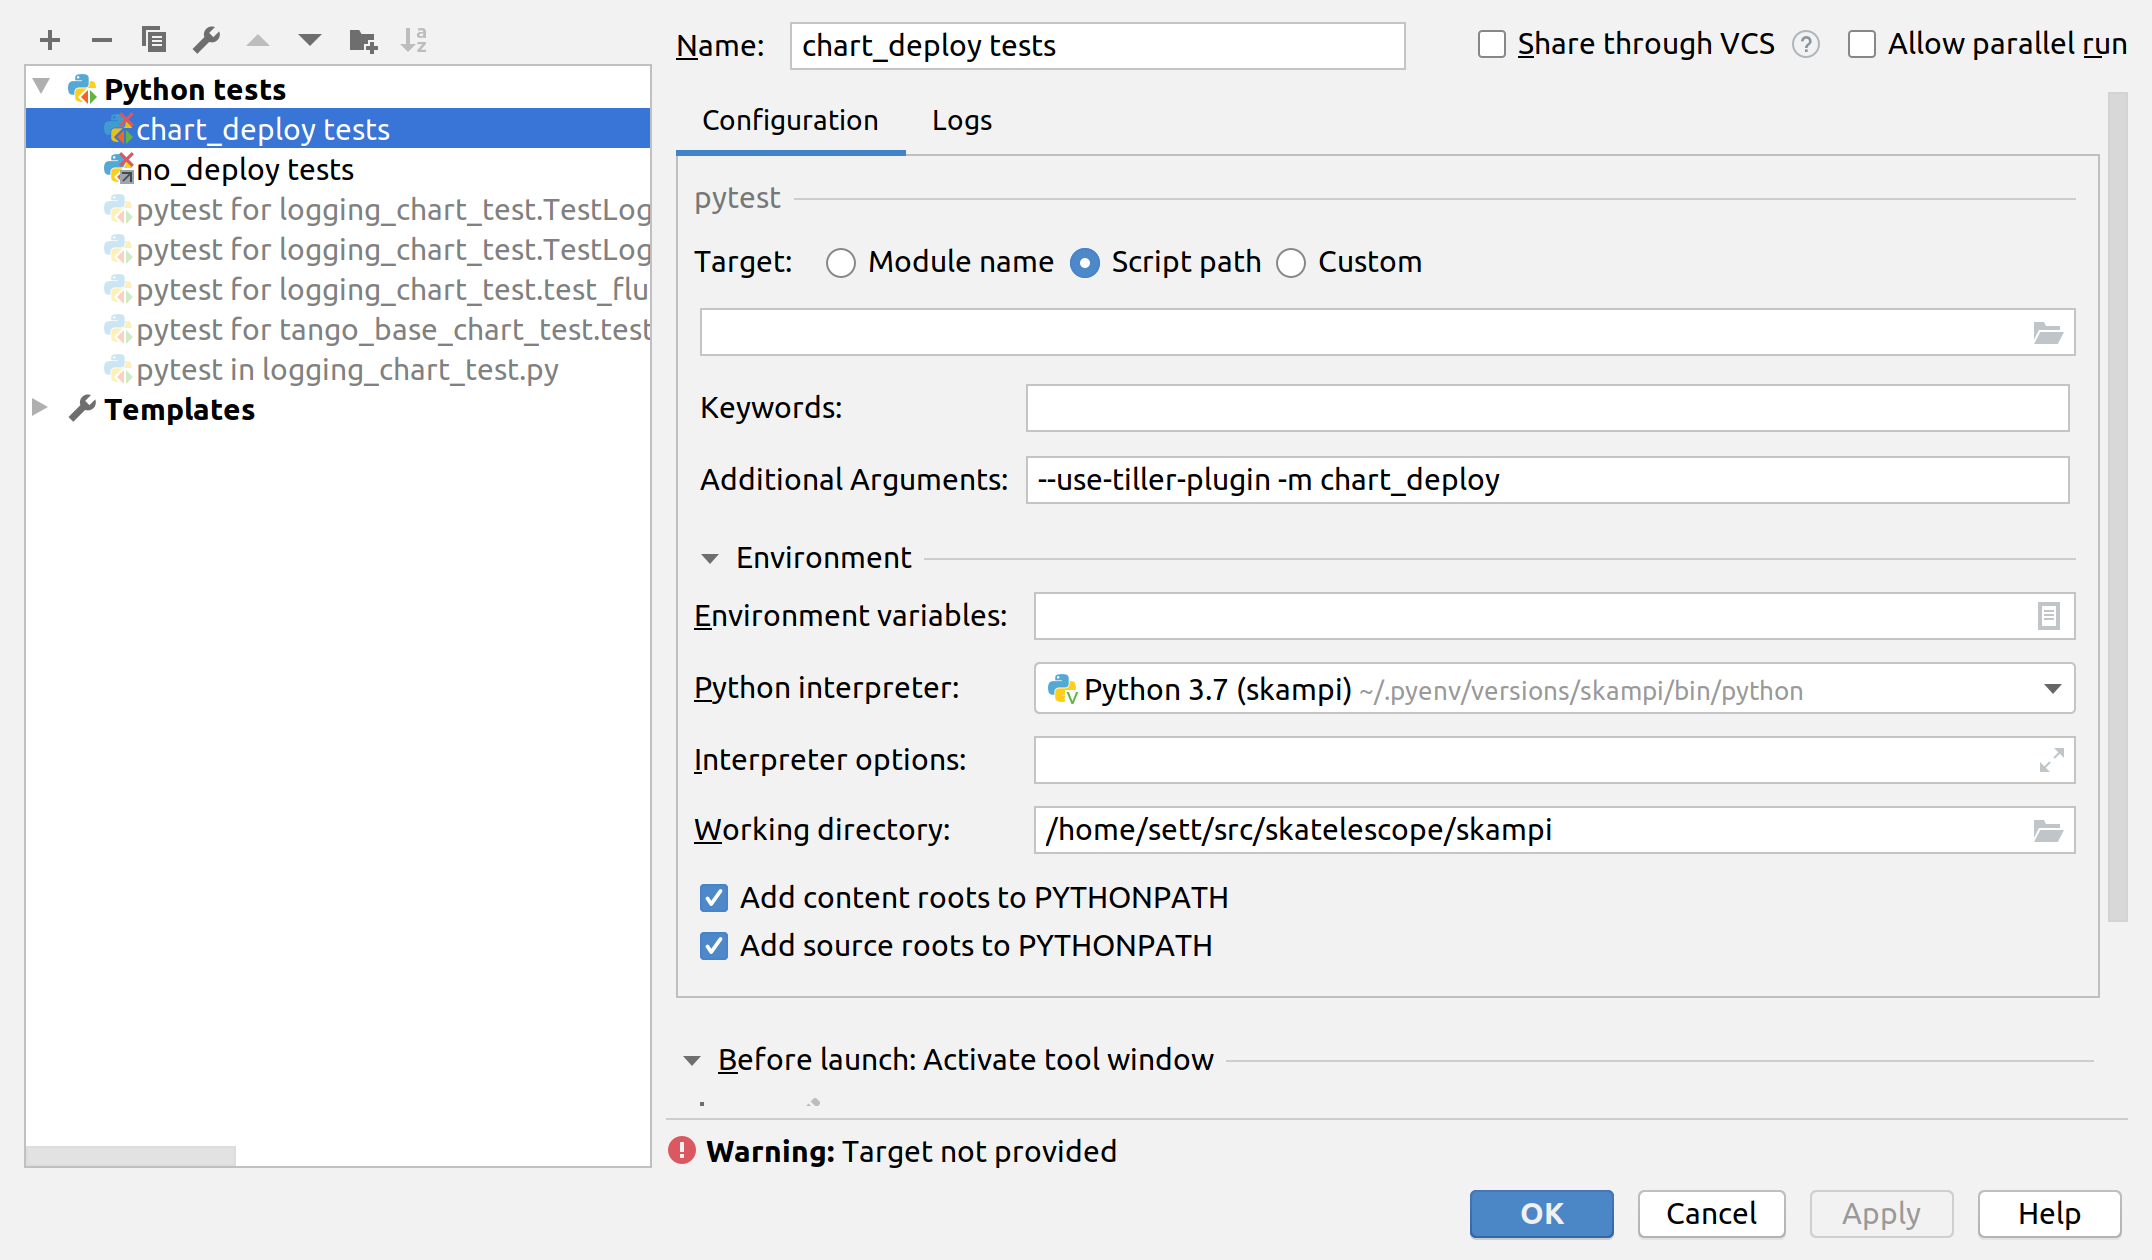
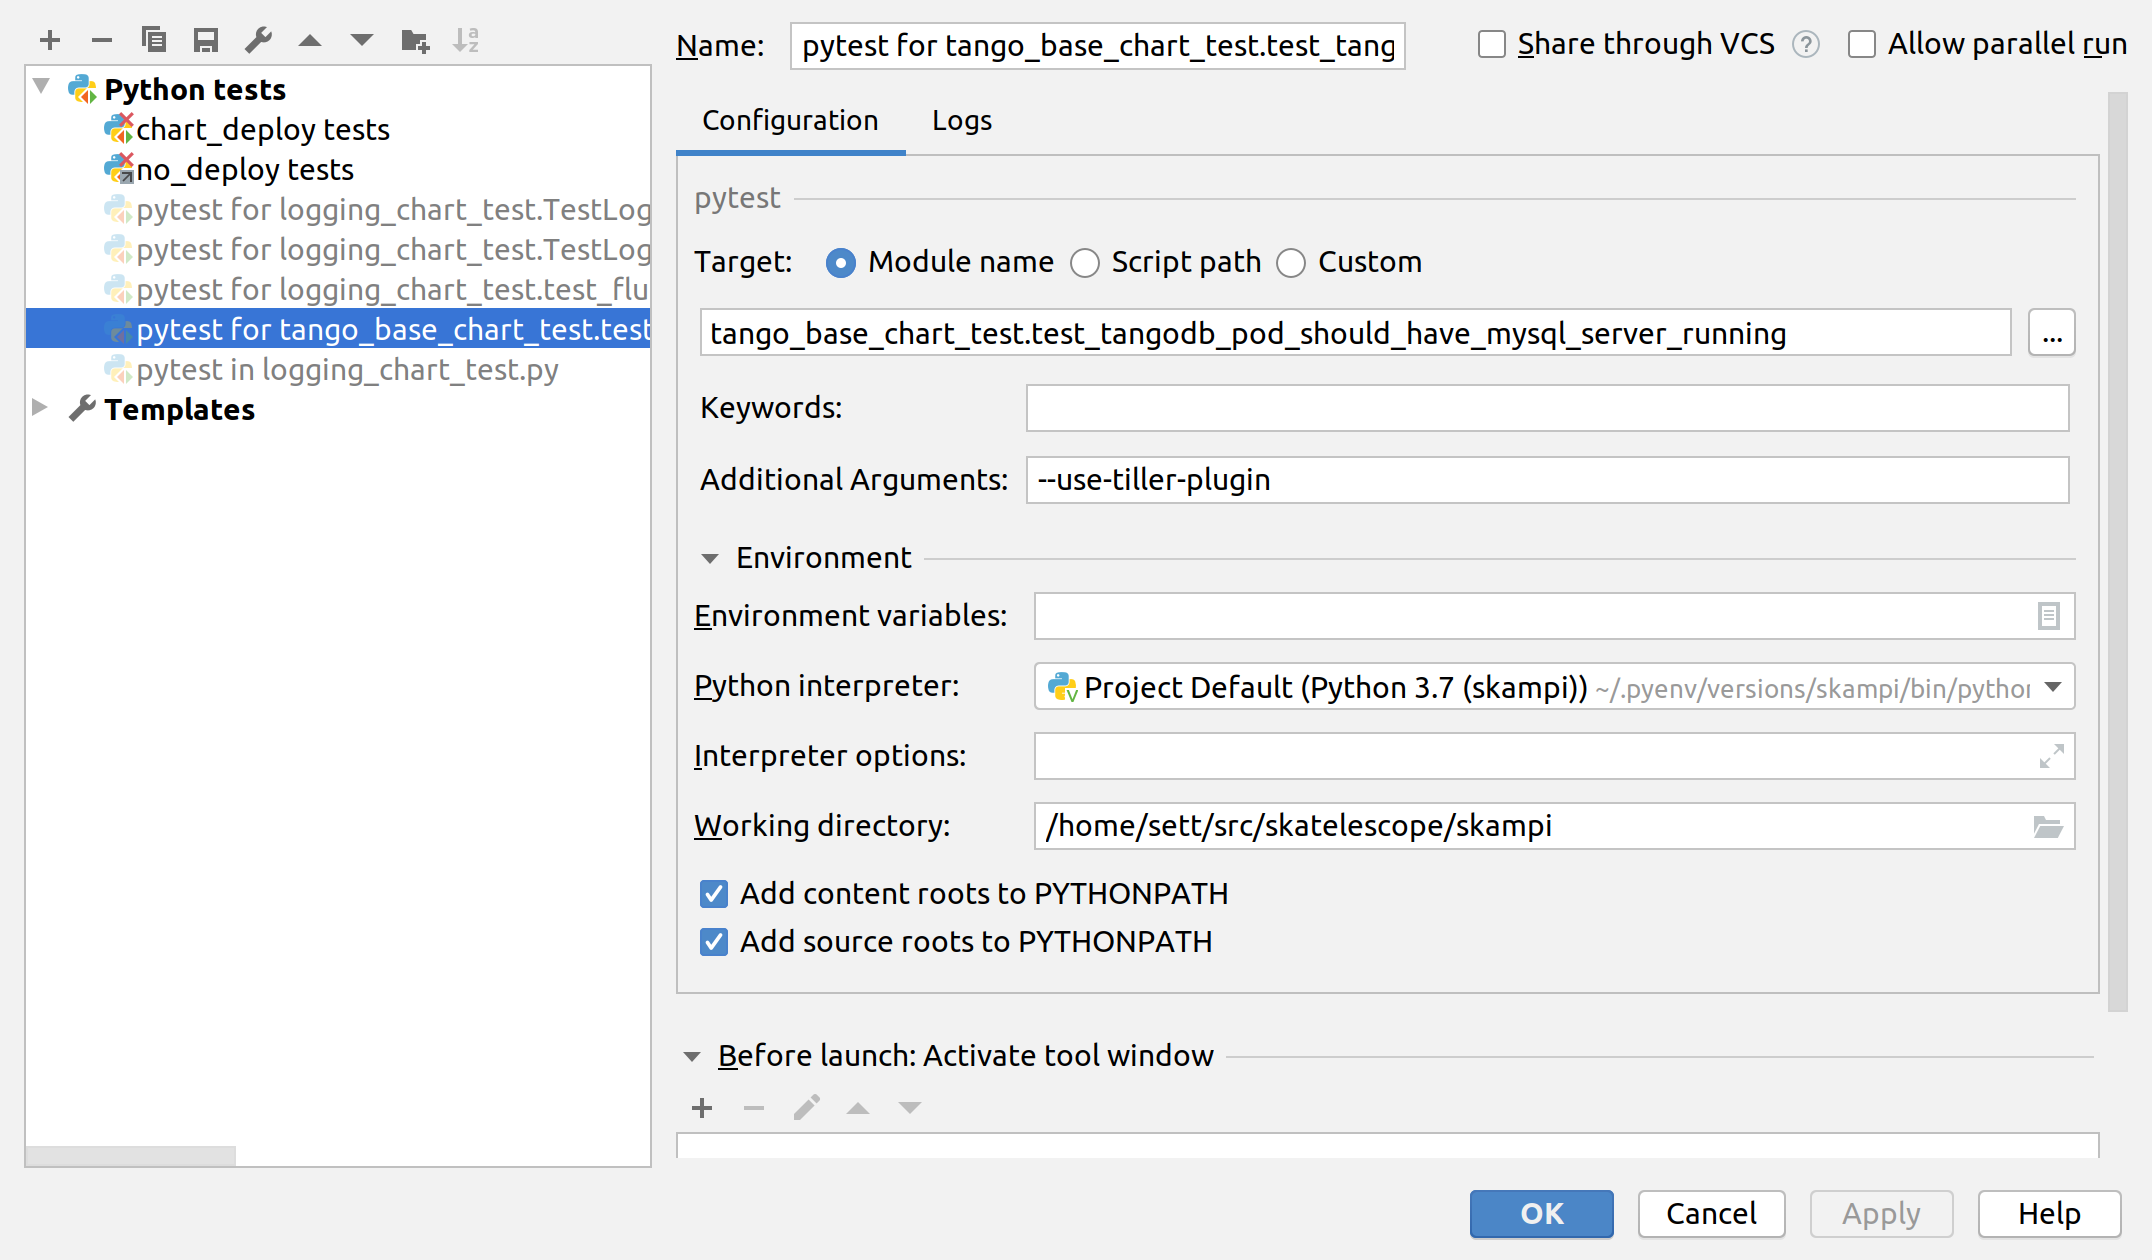
PyCharm as an IDE can be used to run and debug the tests, just be sure to edit the Run/Debug configuration so that it has the appropriate “Additional Arguments” and “Working Directory” (SKAMPI root directory and not /tests).
The following third-party libraries are included in the test-requirements.txt and used by the tests and various supporting testware components:
python kubernetes client is the official kubernetes API client for Python. It’s provided as a pytest fixture,
k8s_apiand also used byChartDeploymentto obtain a list of deployed pods(see get_pods method).testinfra is a library that allows connecting to pods and asserting on the state of various things inside them such as open ports, directory structure, user accounts, etc.
elasticsearch-py is the official, low-level Python client for ElasticSearch.
requests is the popular HTTP client library.