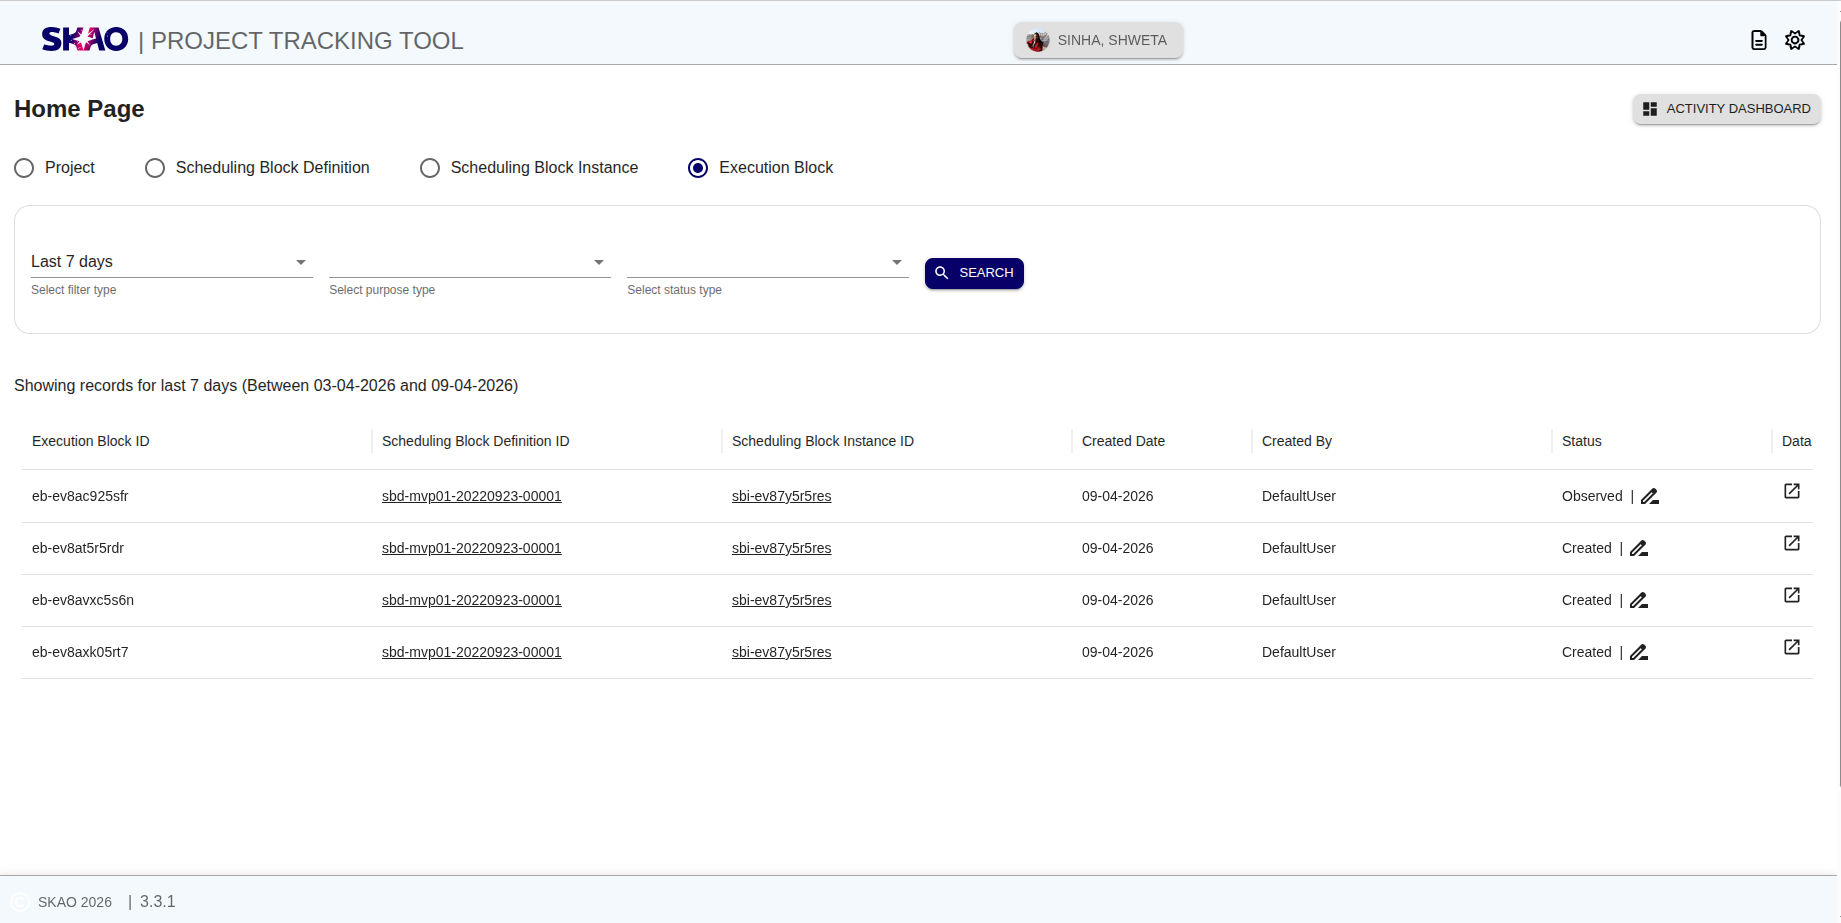
Execution Block Page
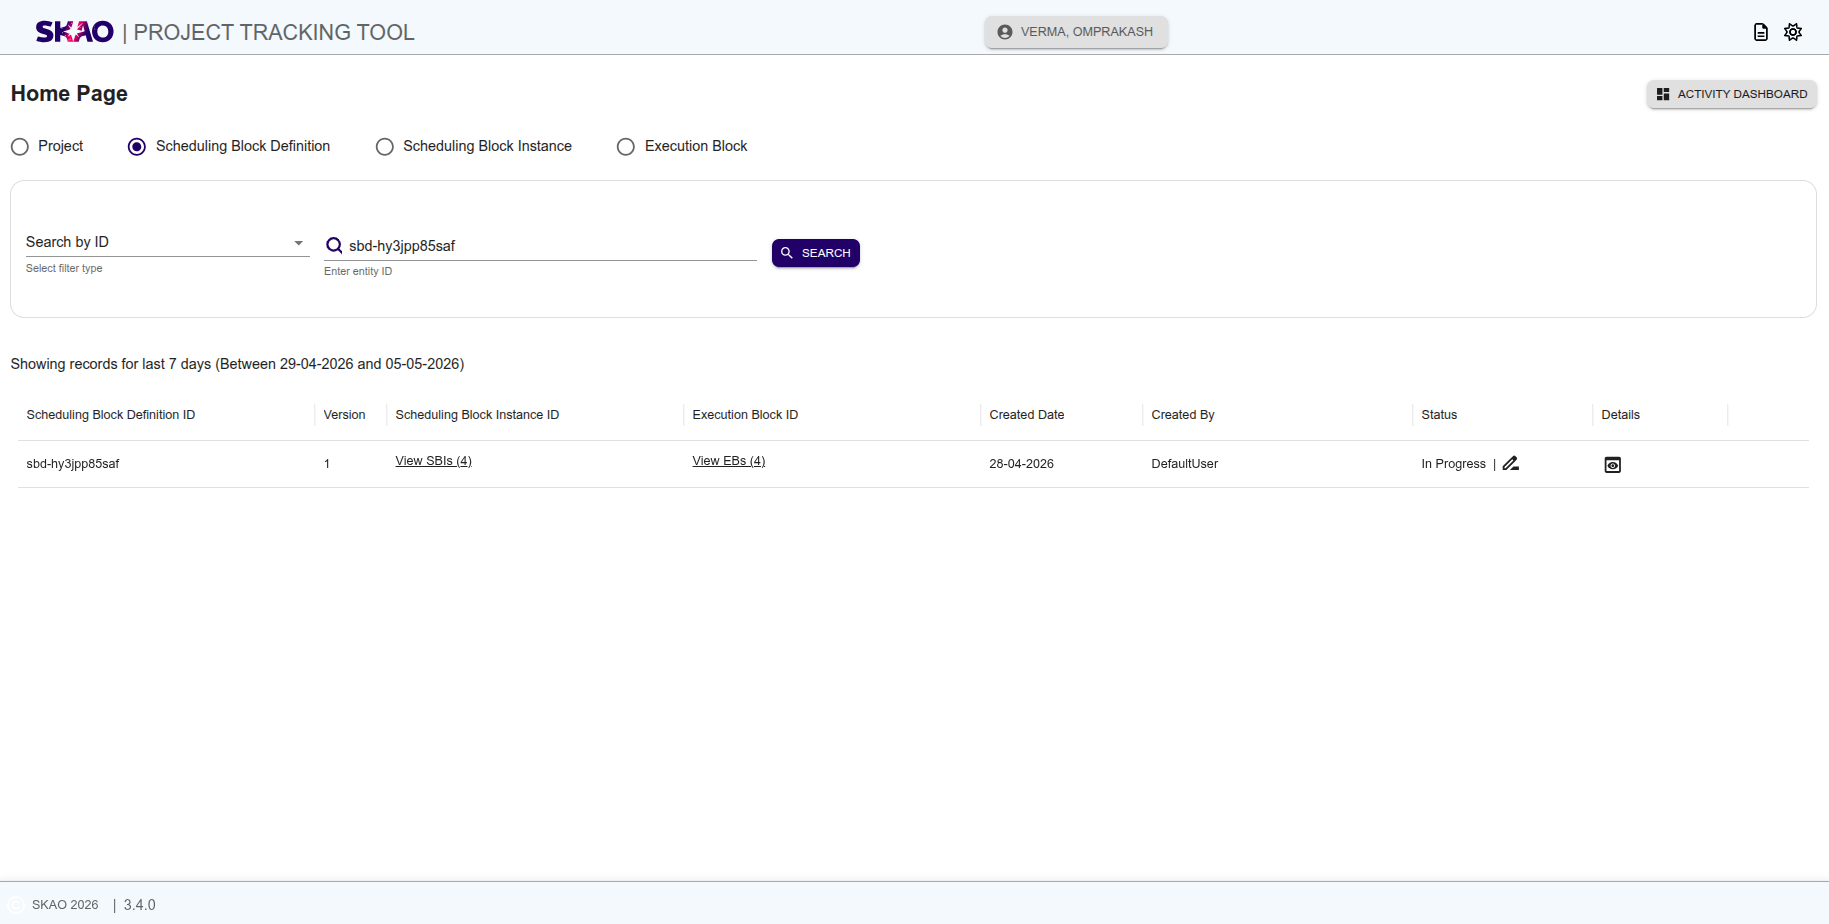
User can search for Execution Block (EB) by clicking on the  button and then selecting a Search Type from the dropdown.
The available search options include:
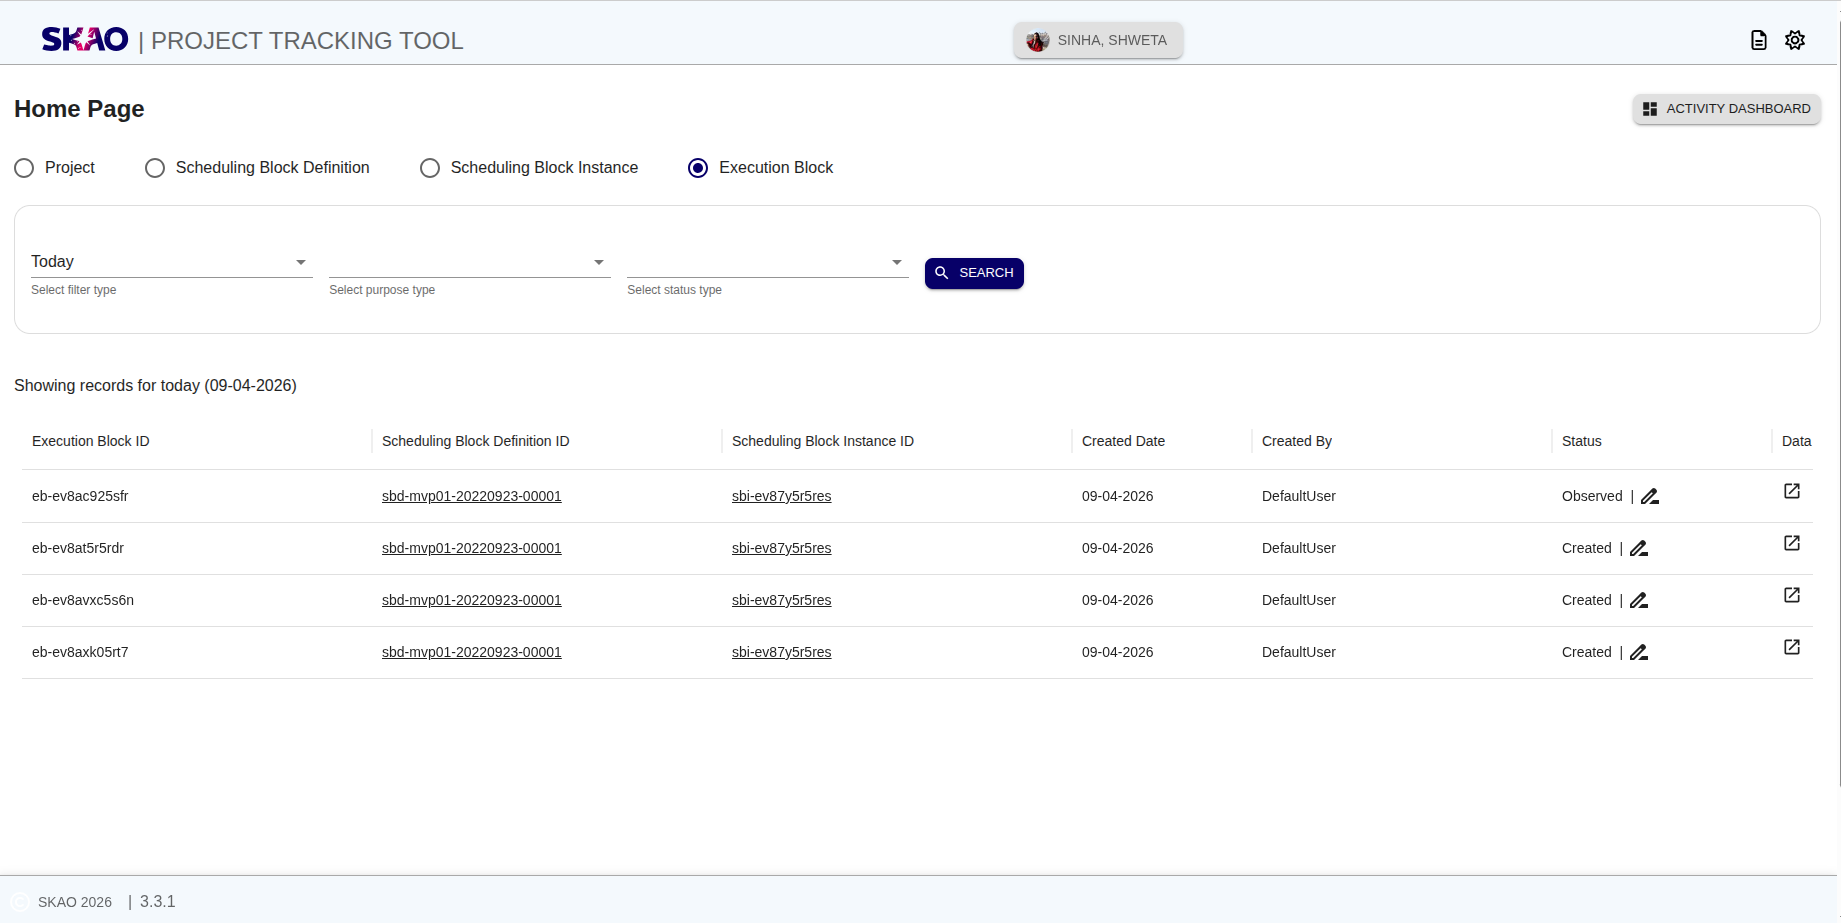
Search by Dates, Search by ID, Last 7 Days, Today, Search by Purpose and Search by Status.
Based on the selected option, the user can provide the required inputs and click the search button to view the records in a tabular format.
View Data Products
A new column named “Data Products” has been added to the Execution Block table.
Each row in this column displays a Data Products icon.
When the user clicks on  icon, they are navigated to the Data Product Dashboard corresponding to the selected Execution Block.
The Data Product Dashboard opens in a new tab and is automatically filtered using the selected Execution Block ID (`eb_id`), allowing the user to view all data products generated for that Execution Block.
Users can configure the Data Product Dashboard URL in the Makefile by setting:
K8S_CHART_PARAMS += \
   --set ska-oso-ptt.dpDashboardURL=<your-dashboard-url>
Note
The DPD links on Execution Block section will not work in the OSO environment. They will function only in environments where the required dependencies and integrations are available and properly configured.
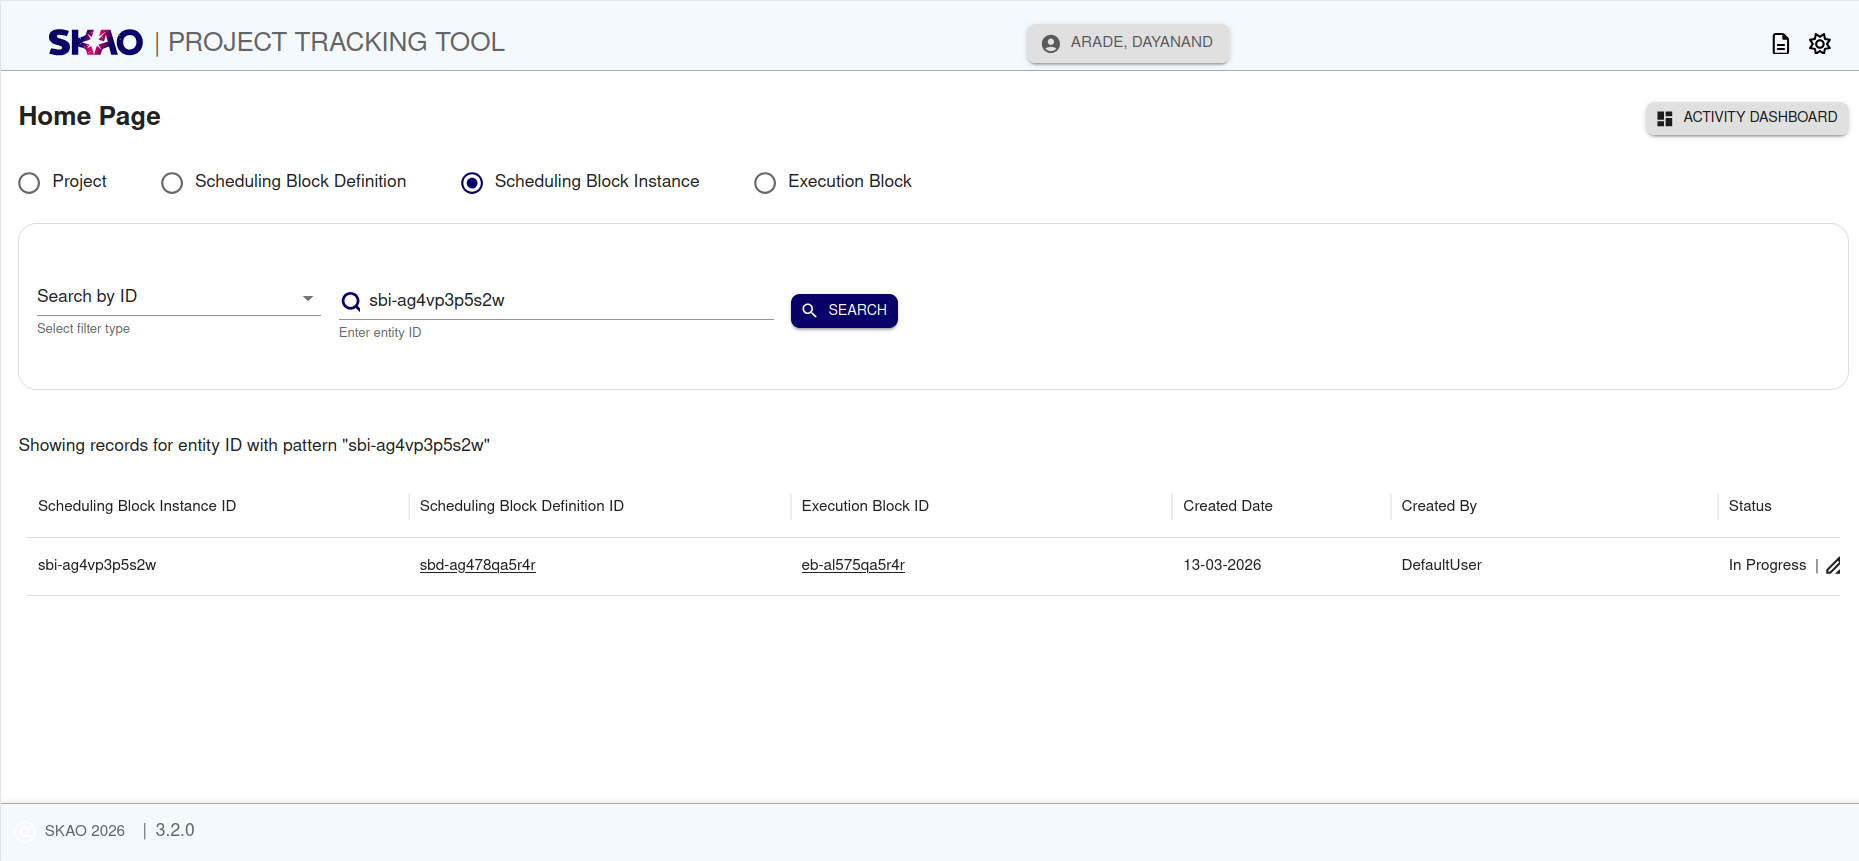
Once the entity records are visible in tabular format user can view the Scheduling Block Definition (SBD) associated with EB ID by clicking on SBD ID from column named ‘Scheduling Block Definition ID’ in the table as shown in below image.
This action will navigate user to Scheduling Block Definition (SBD) page as shown in below image.
User can also view the Scheduling Block Instance (SBI) associated with EB ID by clicking on SBI ID from column named ‘Scheduling Block Instance ID’ in the table as shown in below image.
This action will navigate user to Scheduling Block Instance (SBI) page as shown in below image.
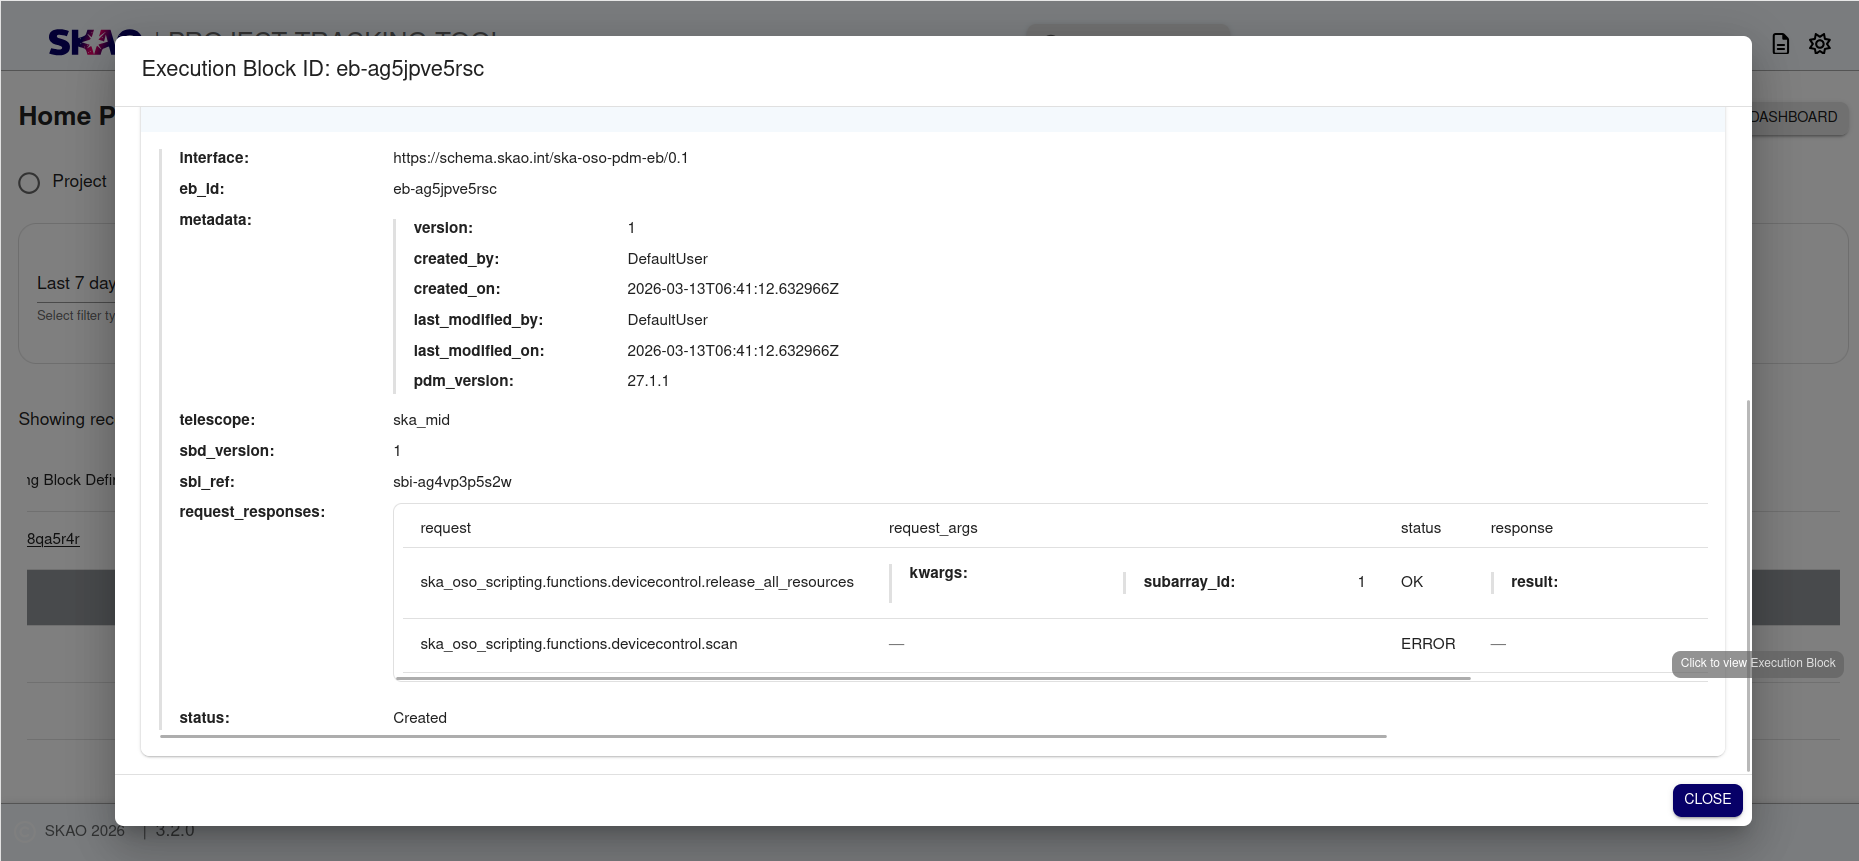
View EB details
Users can click the  icon to see the entity details.
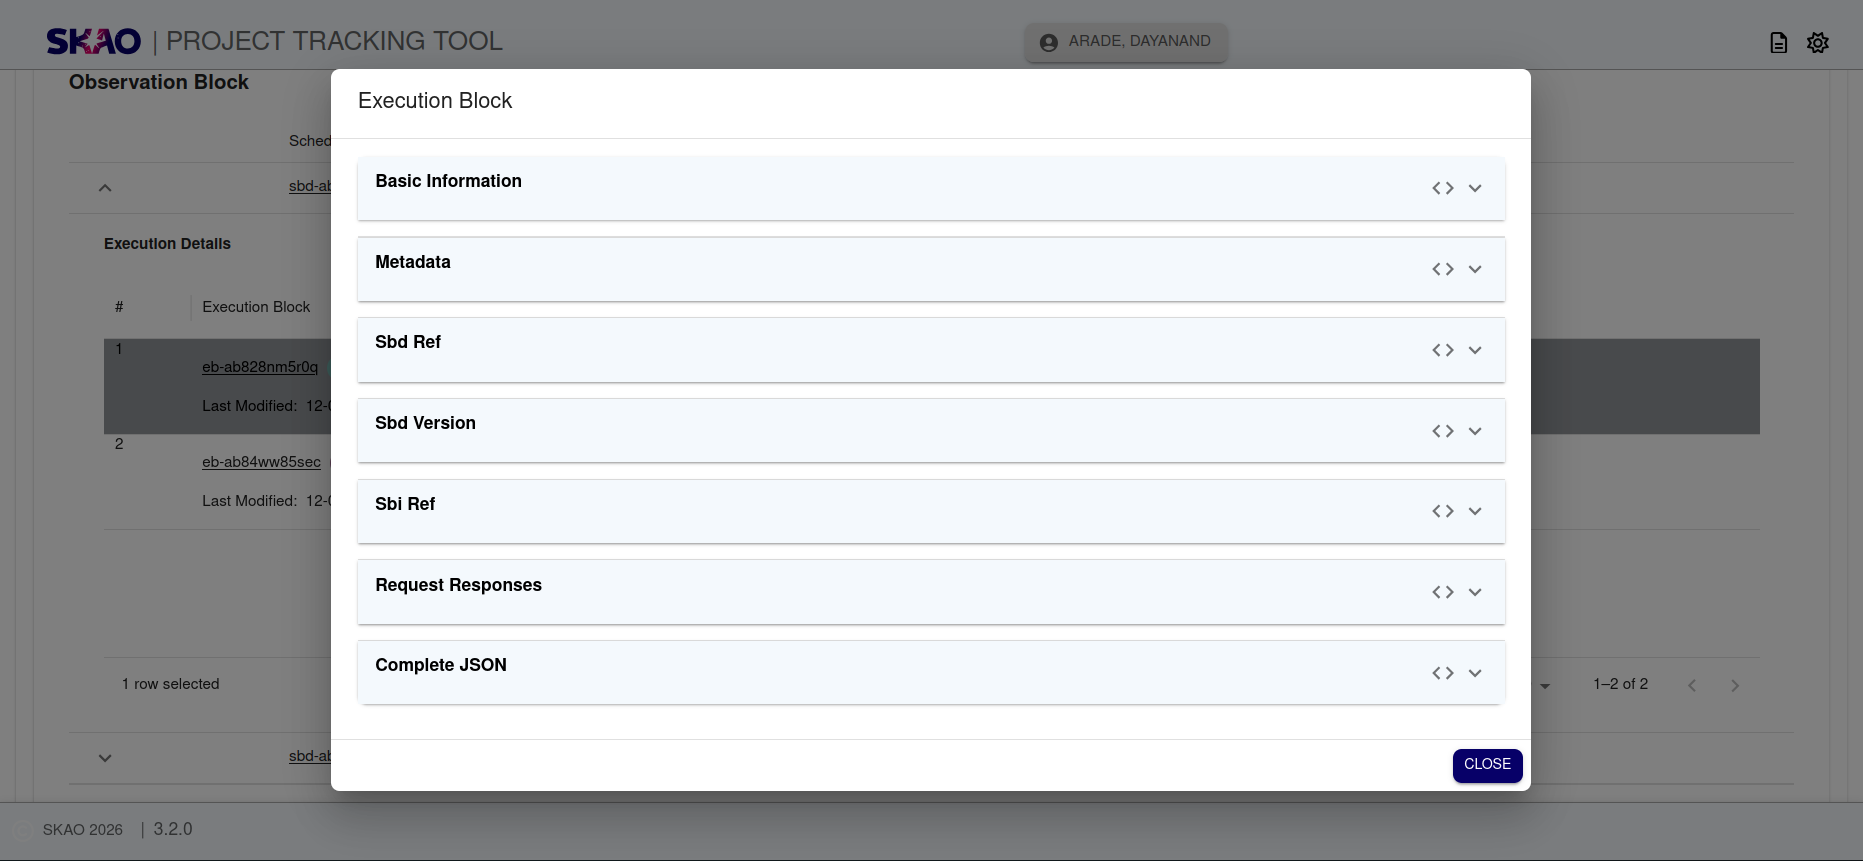
Each panel is interactive and can be clicked to open and view its corresponding details.
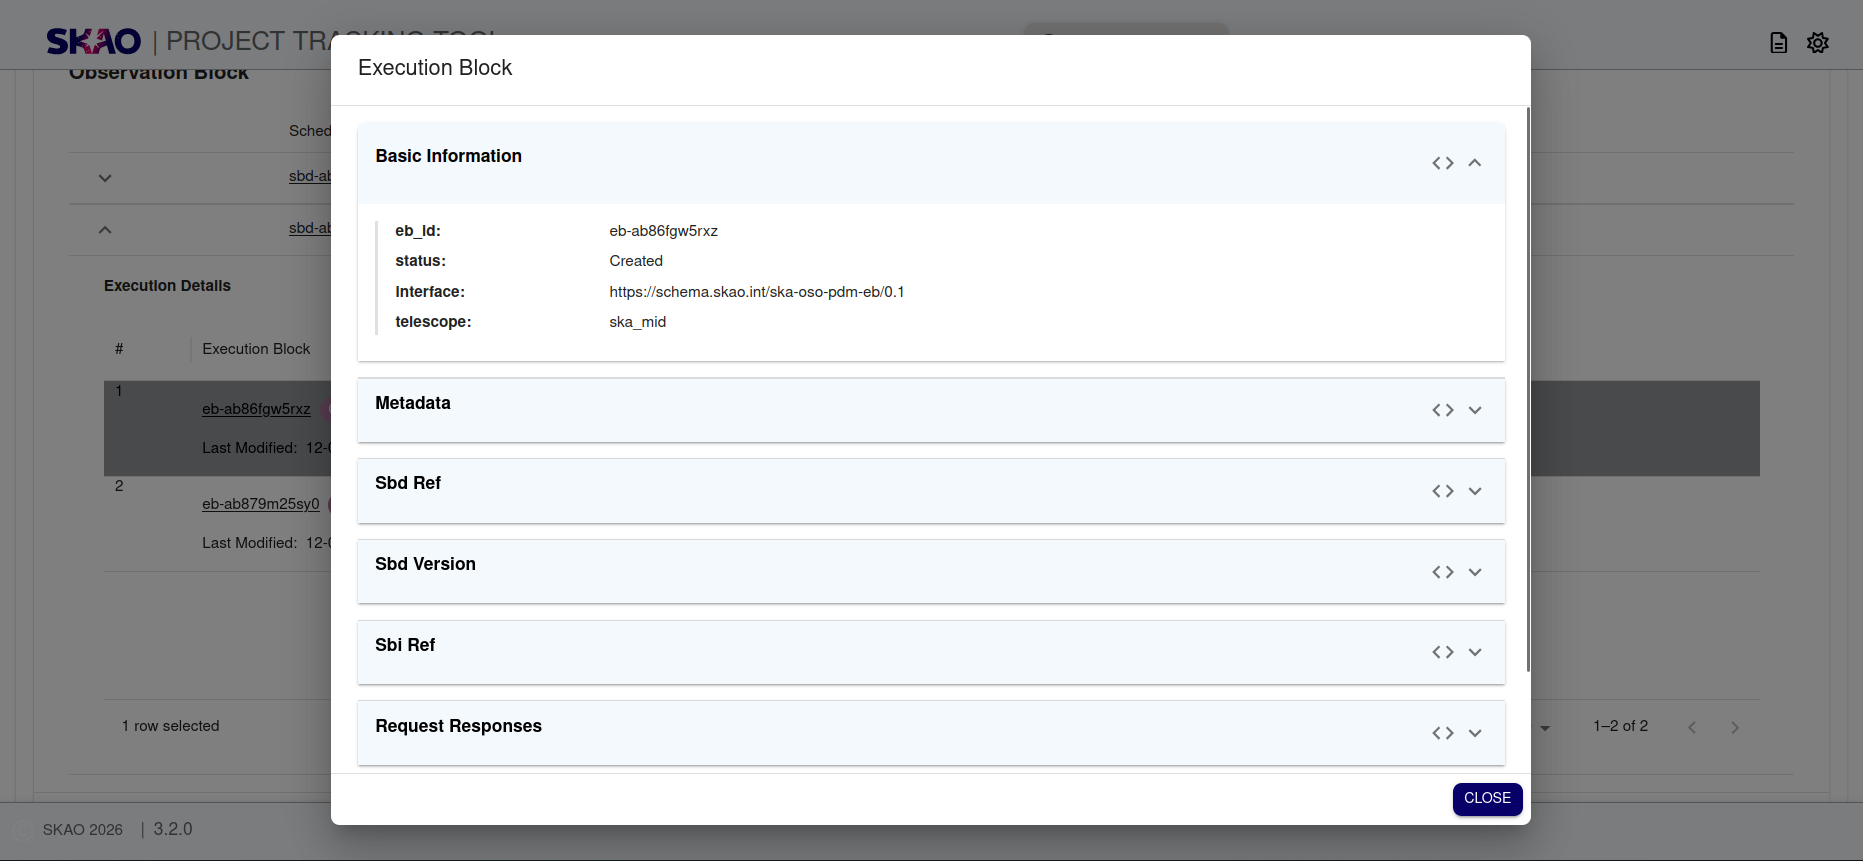
Users can also toggle between GUI mode and JSON mode to view the data in their preferred format.
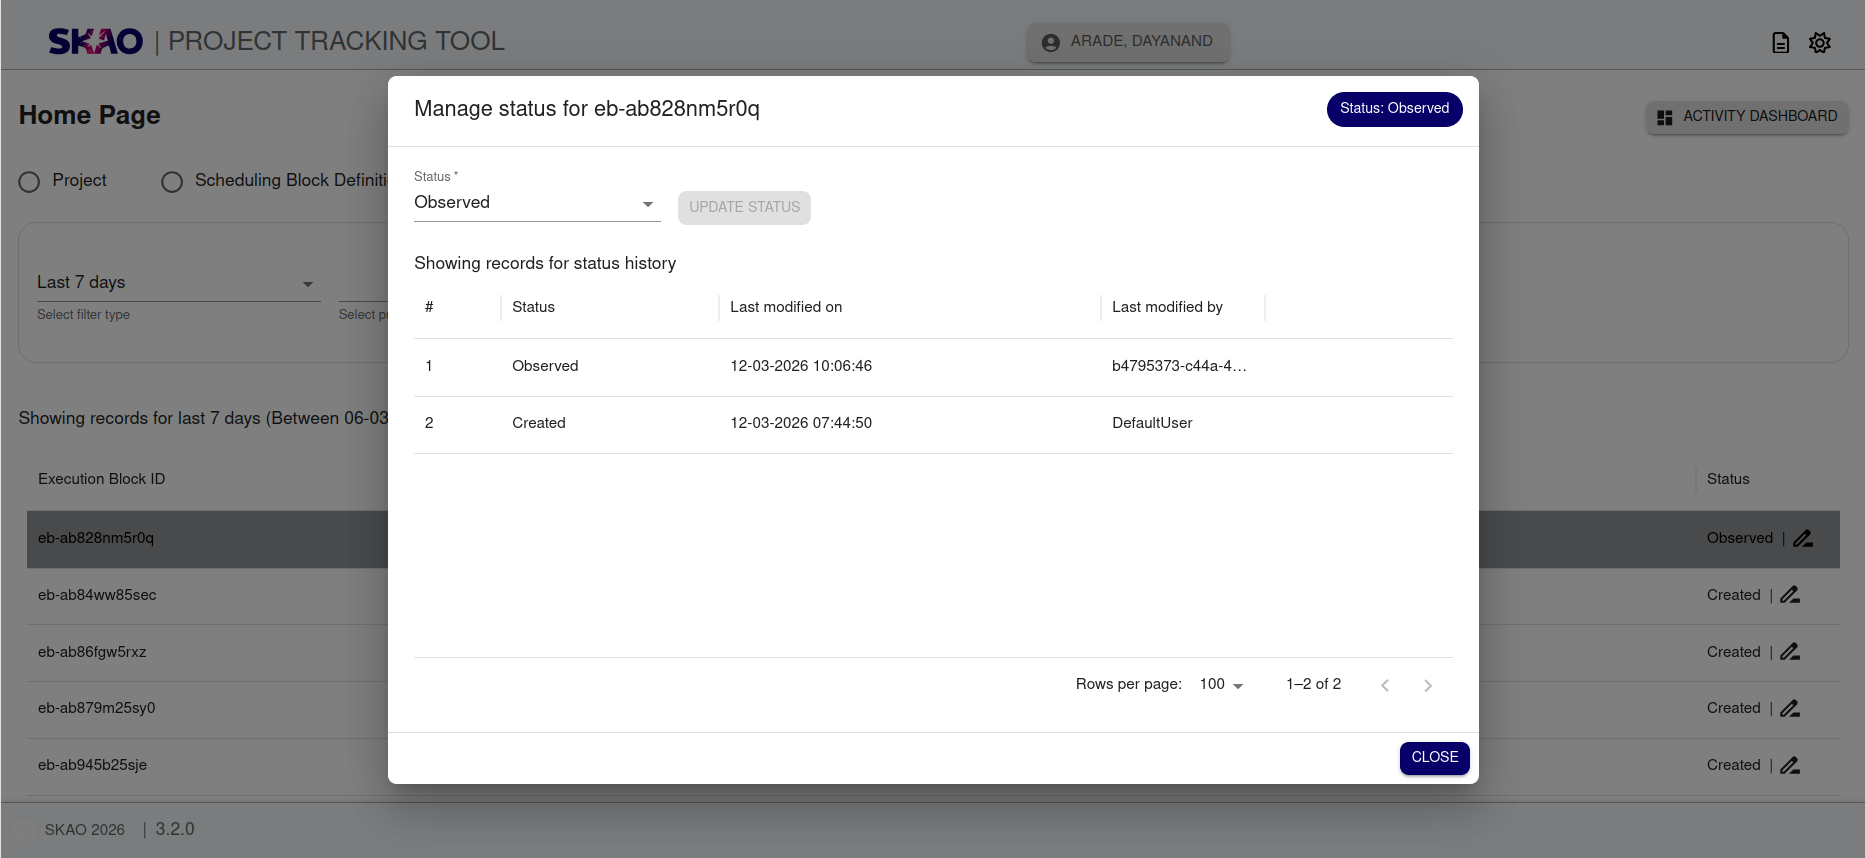
Update EB status
Once the entity records are visible in tabular format as shown below image user can update status of the entity by clicking on edit icon displayed in column named ‘Status’ in the table.
Then a model will open in which user can select the status value from the dropdown widget and click on the  button this will update the status of the entity.
User will also be able to view the status history for selected entity in tabular format as shown in below image.
button this will update the status of the entity.
User will also be able to view the status history for selected entity in tabular format as shown in below image.