Investigating missing Tango events with ska-tango-event-monitor
In this tutorial, we will investigate a Tango control system where we observe a “missing event” using the event monitor. In the process we will learn about the internals of the cppTango ZMQ event system and how to interpret the output of the event monitor script.
Launch the control system
Let’s begin by downloading diagnose-missing-events.tar.bz2. This archive contains all the necessary scripts and configuration files required to run the tutorial demo. Once the download is complete, extract the contents of the archive and enter the project directory:
$ tar xaf diagnose-missing-events.tar.bz2
$ cd diagnose-missing-events
Next, let’s launch the demo control system using docker compose:
$ docker compose up --detach --build
Once the control system is up and running, we can install ska-tango-event-monitor script into a virtual environment:
python3 -m pip --require-virtualenv install --extra-index-url https://artefact.skao.int/repository/pypi-all/simple ska-tango-event-monitor[tutorial]
Finally, from an itango console, we can verify the control system is running by ping()’ing some devices:
In [1]: hw = Device("foo/bar/hw")

In [2]: hw.ping()
Out[2]: 238

In [3]: top = Device("foo/bar/top")

In [4]: top.ping()
Out[4]: 243
Demonstrating the problem
The control system you have just deployed exhibits a defect which could be described as a missing event. This example is based on a real SKAO subsystem which exhibited a similar defect. Before we describe the defect, let’s first introduce our demo control system.
The control system we just deployed has two devices of interest as shown in Diagram 1.
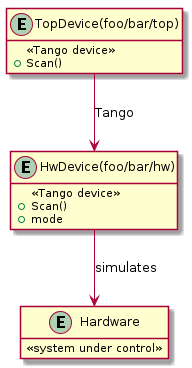
Diagram 1: Hierarchy of deployed devices. The Hardware is not actually deployed in this demo, but instead entirely simulated in the HwDevice.
The user interacts directly with the TopDevice to start a scan with the Scan() command. This command is forwarded to the HwDevice. For the HwDevice, the Scan() command returns as soon as the scan has been started. Clients are expected to monitor the mode attribute to know when the scan has completed. To provide a nicer experience for the user, TopDevice does the monitoring of the mode attribute for you and will not return until the HwDevice has finished and the TopDevice has received an IDLE event.
Diagram 2 shows what we expect to happen when we call the Scan() command:
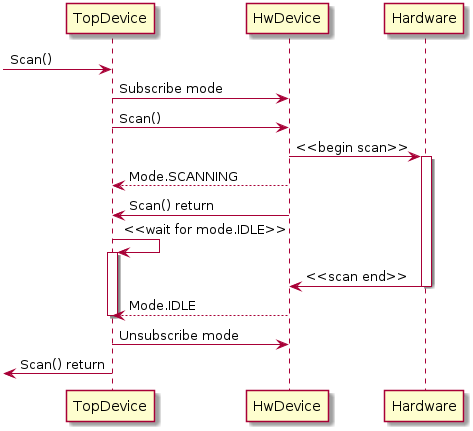
Diagram 2: Expected sequence diagram from Scan() command.
Let’s give it a go and see what happens when we run the Scan() command:
In [1]: top = DeviceProxy("foo/bar/top")

In [2]: top.get_command_config("Scan").in_type_desc
Out[2]: 'Run a scan. This command takes at most 30 seconds to complete. You should increase your client timeout before calling this.'

In [3]: top.set_timeout_millis(60000)

In [4]: top.Scan()
PyDs_PythonError: RuntimeError: Timeout waiting for Mode.IDLE

(For more detailed information type: tango_error)
We hit a timeout! The TopDevice never received the Mode.IDLE event it was expecting during its 30 second timeout.
Note
Here, we are increasing the client side timeout with the call to tango.DeviceProxy.set_timeout_millis() as instructed by the command’s documentation.
What is curious is that the HwDevice has logged that it did push this event in ~13 seconds which is much less than our 30 second timeout:
$ docker compose logs dev-hw
dev-hw-1  | Ready to accept request
dev-hw-1  | Starting scan -- pushing Mode.SCANNING
dev-hw-1  | Scan complete in 12.85 s -- pushed Mode.IDLE
Initial investigation with the event monitor
Let’s monitor the Tango event system while the Scan() command is running to see what is going on. First, in a separate terminal let’s start the ska-tango-event-monitor script running, pointing it at both our Tango devices:
$ ska-tango-event-monitor foo/bar/hw foo/bar/top
===============================================2026-03-13T16:35:33.678998===============================================
-----------------------------------------dserver/MyServer/hw (from foo/bar/hw)------------------------------------------
- New publishers
          foo/bar/hw/mode.change: 2 is the last pushed server counter
      foo/bar/hw/position.change: 128 is the last pushed server counter
----------------------------------------dserver/MyServer/top (from foo/bar/top)-----------------------------------------
- New subscriptions
      foo/bar/hw/mode.idl5_change: 2 events already processed
                                 : 2 is the last received server counter
                                 : 1 callback(s) registered
                                 : 0 missed events detected
                                 : 1 events discarded
      foo/bar/hw/position.idl5_change: 128 events already processed
                                     : 128 is the last received server counter
                                     : 1 callback(s) registered
                                     : 0 missed events detected
                                     : 0 events discarded
===============================================2026-03-13T16:35:33.678998===============================================
How do we interpret this output?
The event monitor uses the QueryEventSystem() admin device command to collect snapshots of the event system for each device server simultaneously. As the snapshots contain a lot of information, the ska-tango-event-monitor script outputs the difference of each snapshot from the previous snapshot. Above shows the initial snapshot captured by the script. For this initial snapshot everything is new and we can see the state of the event system some time after we have run our Scan() command. The script will continue to output snapshot summaries every 10 seconds, however, these will be empty as there are no events being sent at the moment and nothing is changing with the event system:
===============================================2026-03-13T16:35:43.689001===============================================
-----------------------------------------dserver/MyServer/hw (from foo/bar/hw)------------------------------------------

----------------------------------------dserver/MyServer/top (from foo/bar/top)-----------------------------------------

===============================================2026-03-13T16:35:43.689001===============================================
Note
The Tango event system is shared by the entire device server process and it is this shared event system that we are taking snapshots of. The ska-tango-event-monitor script resolves each Tango device to the corresponding device server. If multiple devices live in the same server, then there will only be a single entry for that entire device server, even if the multiple devices were requested.
The information presented in this first snapshot is already interesting. We can see that dserver/MyServer/hw device server (which is where foo/bar/hw resides) currently has publishers for pushing change events for two attributes:
foo/bar/hw/modefoo/bar/hw/position
These publishers are only activated if there is a subscriber that has registered interest in the event stream, so something is currently subscribing to these attributes. But what do the numbers mean after them? There is this curious phrase “2 is the last pushed server counter”.
Each publisher has an associated counter that is incremented every time the publisher sends an event (after Tango has filtered out events due to e.g. abs_change). This counter is sent along with the event data to the client and the phrase “2 is the last pushed server counter” means that the last event that was sent included a counter with a value of 2. This also means that 2 events have been sent on this event stream since the client subscribed, as the counter starts at 1.
You can probably guess that the two mode events correspond to the Mode.SCANNING and Mode.IDLE log lines we saw from the foo/bar/hw device. We also have 128 position events that have been pushed. We didn’t mention this earlier, but there is another ominously named RogueDevice that is forwarding a position attribute and a mode attribute from the HwDevice. It has subscribed to change events for these attributes and forwards the events it receives. It is these event subscriptions that we see here. As there is no client subscribed to this RogueDevice, we do not see any publishers for these event stream.
On the client side, we can see that the dserver/MyServer/top device server (which is where foo/bar/top resides) is currently subscribing to the same change event streams:
foo/bar/hw/modefoo/bar/hw/position
Note
On the client side, we have idl5_change whereas on the server side it is simply change. This is related to backwards compatibility of the Tango event system. On the client side we see a ZMQ topic that is used to send the event data over. However, on the server side we see a “event stream” which comprises multiple ZMQ topics with each topic supporting a slightly different event data format. In most cases, this distinction can be safely ignored.
On the client side, we get more numbers to look at for each event stream. The “2 events already processed” and “2 is the last received server counter” phrases are hopefully self explanatory. For this event stream, the client has processed 2 events and also the counter it received with the most recently processed event was 2. These numbers might get out of sync if, for example, the device server pushing the events is restarted or if some other client subscribed to this event stream and received some events before we did. In our case these two counters are in sync with each other and they are also in sync with the publisher pushing the events.
In other words, Tango thinks all the events pushed were processed, including the Mode.IDLE event we seemed to miss.
This is reinforced by the “0 missed events detected” phrases. A missed event would be detected if the counter received from the server skipped a value and we can see here that Tango never saw this happen. If Tango did detect a missed event like this, it would push an “error event” to the client callback.
Note
The “1 events discarded” phrase is often not interesting. A discarded event means that the Tango event system received the same event counter twice in a row. This can happen if the ZMQ socket is unsure if we received the event, so it sends it again just in case. This is most likely to happen during the initial subscription and is harmless.
This is all very interesting. Tango thinks that we received all of the events, but clearly we didn’t receive the Mode.IDLE event. What is going on?
Live monitoring of a scan
Let’s try running another Scan() while the event monitor is running to get some more clues. When you run this, the event monitor will output something like the following:
 1===============================================2026-03-17T11:14:43.725534===============================================
 2-----------------------------------------dserver/MyServer/hw (from foo/bar/hw)------------------------------------------
 3- Published events
 4            foo/bar/hw/mode.change: 2 -> 3 (+1) last pushed server counter
 5        foo/bar/hw/position.change: 128 -> 175 (+47) last pushed server counter
 6----------------------------------------dserver/MyServer/top (from foo/bar/top)-----------------------------------------
 7- Received events and callback changes
 8            foo/bar/hw/mode.idl5_change: 2 -> 3 (+1) events processed
 9                                       : 2 -> 3 (+1) last received server counter
10                                       : 1 -> 2 (+1) callbacks
11        foo/bar/hw/position.idl5_change: 128 -> 144 (+16) events processed
12                                       : 128 -> 144 (+16) last received server counter
13===============================================2026-03-17T11:14:43.725534===============================================
14
15
16
17===============================================2026-03-17T11:14:53.733599===============================================
18-----------------------------------------dserver/MyServer/hw (from foo/bar/hw)------------------------------------------
19- Published events
20            foo/bar/hw/mode.change: 3 -> 4 (+1) last pushed server counter
21        foo/bar/hw/position.change: 175 -> 256 (+81) last pushed server counter
22----------------------------------------dserver/MyServer/top (from foo/bar/top)-----------------------------------------
23- Received events and callback changes
24        foo/bar/hw/position.idl5_change: 144 -> 177 (+33) events processed
25                                       : 144 -> 177 (+33) last received server counter
26===============================================2026-03-17T11:14:53.733599===============================================
27
28
29
30===============================================2026-03-17T11:15:03.744107===============================================
31-----------------------------------------dserver/MyServer/hw (from foo/bar/hw)------------------------------------------
32
33----------------------------------------dserver/MyServer/top (from foo/bar/top)-----------------------------------------
34- Received events and callback changes
35        foo/bar/hw/position.idl5_change: 177 -> 210 (+33) events processed
36                                       : 177 -> 210 (+33) last received server counter
37===============================================2026-03-17T11:15:03.744107===============================================
38
39
40
41===============================================2026-03-17T11:15:13.754068===============================================
42-----------------------------------------dserver/MyServer/hw (from foo/bar/hw)------------------------------------------
43
44----------------------------------------dserver/MyServer/top (from foo/bar/top)-----------------------------------------
45- Received events and callback changes
46            foo/bar/hw/mode.idl5_change: 2 -> 1 (-1) callbacks
47        foo/bar/hw/position.idl5_change: 210 -> 244 (+34) events processed
48                                       : 210 -> 244 (+34) last received server counter
49===============================================2026-03-17T11:15:13.754068===============================================
50
51
52
53===============================================2026-03-17T11:15:23.764071===============================================
54-----------------------------------------dserver/MyServer/hw (from foo/bar/hw)------------------------------------------
55
56----------------------------------------dserver/MyServer/top (from foo/bar/top)-----------------------------------------
57- Received events and callback changes
58            foo/bar/hw/mode.idl5_change: 3 -> 4 (+1) events processed
59                                       : 3 -> 4 (+1) last received server counter
60        foo/bar/hw/position.idl5_change: 244 -> 256 (+12) events processed
61                                       : 244 -> 256 (+12) last received server counter
62===============================================2026-03-17T11:15:23.764071===============================================
The output here contains 5 snapshots gathered at a 10-second interval. The first of these (lines 1-13) shows that the hardware device pushed a single mode event (presumably with Mode.SCANNING) and 47 position events. We can also see that the top device processed the mode event and added an additional mode callback (used by the Scan() command to wait for the Mode.IDLE event). However, the top device only processed 16 of the position events in this period. It turns out, this is the root of our issue.
Tip
The rate these snapshots are gathered can be controlled with the --polling-period option. Take care setting this too fast as the command sent to the device server locks out other clients from subscribing to events on this device server.
In the second snapshot (lines 17-26), we see that the hardware device finishes sending its events however the top device is still busy processing them for another 3 snapshots and we do not see the Mode.IDLE event until the final sample (lines 53-62). Notice in the penultimate snapshot (lines 41-49), we see the number of mode callbacks decrease. This corresponds to the Scan() command giving up and unsubscribing from mode change events. The Scan() command does not have a long enough timeout given all the events that have to be processed by the device server during the scan.
The key point here is that the processing of the position events is not part of Scan() command, in fact, the subscription to the position is done by the RogueDevice, an entirely unrelated device. Despite being unrelated, the activity of this RogueDevice is influencing the command being executed by our TopDevice. The Tango event system is a shared resource that couples all Tango devices deployed in the same device server. If one device is slow to process its events, this can introduce latencies for events that other Tango devices in the same device server are waiting for.
In this simple example, we could probably work out where the problem is with this information and from just looking at the code. However, in more complicated scenarios it perhaps isn’t so obvious what is going on. To help gather more details in these scenarios, the event monitor can request each device server turns on event system performance monitoring and print statistical summaries of the performance data. Let’s have a look at this next.
Performance monitoring of a scan
To enable performance monitoring, we need to restart the ska-tango-event-monitor script with the --monitor option:
> ska-tango-event-monitor --monitor foo/bar/hw foo/bar/top
===============================================2026-03-17T12:21:25.321968===============================================
-----------------------------------------dserver/MyServer/hw (from foo/bar/hw)------------------------------------------
- New publishers
            foo/bar/hw/mode.change: 4 is the last pushed server counter
        foo/bar/hw/position.change: 256 is the last pushed server counter
----------------------------------------dserver/MyServer/top (from foo/bar/top)-----------------------------------------
- New subscriptions
            foo/bar/hw/mode.idl5_change: 4 events already processed
                                       : 4 is the last received server counter
                                       : 1 callback(s) registered
                                       : 0 missed events detected
                                       : 2 events discarded
        foo/bar/hw/position.idl5_change: 256 events already processed
                                       : 256 is the last received server counter
                                       : 1 callback(s) registered
                                       : 0 missed events detected
                                       : 0 events discarded
===============================================2026-03-17T12:21:25.321968===============================================
Initially, nothing much seems to have changed. However, if we set off another scan, we will now see some performance statistics:
  1===============================================2026-03-17T12:42:21.916829===============================================
  2-----------------------------------------dserver/MyServer/hw (from foo/bar/hw)------------------------------------------
  3- Published events
  4            foo/bar/hw/mode.change: 4 -> 5 (+1) last pushed server counter
  5        foo/bar/hw/position.change: 256 -> 315 (+59) last pushed server counter
  6- Server performance
  7                       mean      median  count  minimum  maximum   1%   10%     90%    99%
  8 Event Gaps [ms]  764.69±660.26  100.41    60     0.05   40048.41      100.20  101.08
  9  Push Time [μs]    47.17±2.48   40.00     60     4.00    116.00       30.00   65.00
 10----------------------------------------dserver/MyServer/top (from foo/bar/top)-----------------------------------------
 11- Received events and callback changes
 12            foo/bar/hw/mode.idl5_change: 4 -> 5 (+1) events processed
 13                                       : 4 -> 5 (+1) last received server counter
 14                                       : 1 -> 2 (+1) callbacks
 15        foo/bar/hw/position.idl5_change: 256 -> 276 (+20) events processed
 16                                       : 256 -> 276 (+20) last received server counter
 17- Client performance
 18                                     mean      median  count  minimum  maximum   1%   10%     90%    99%
 19               Event Gaps [ms]  991.47±688.67  300.91    20     0.13   14413.12      300.42  301.52
 20               Sleep Time [ms]  720.68±702.40   0.02     20     0.01   14412.92       0.01    0.12
 21                   Latency [s]    1.71±0.25     1.70     20     0.00     3.61         0.02    3.39
 22              Callbacks called    1.05±0.05     1.00     20     1.00     2.00         1.00    1.00
 23                    Wake Count    1.40±0.39     1.00     20     1.00     9.00         1.00    1.00
 24     mode Processing Time [μs]   127.00±0.00   127.00    1     127.00   127.00
 25 position Processing Time [ms]   300.83±0.08   300.83    19    300.39   301.50       300.45  301.36
 26===============================================2026-03-17T12:42:21.916829===============================================
 27
 28
 29
 30===============================================2026-03-17T12:42:31.927772===============================================
 31-----------------------------------------dserver/MyServer/hw (from foo/bar/hw)------------------------------------------
 32- Published events
 33            foo/bar/hw/mode.change: 5 -> 6 (+1) last pushed server counter
 34        foo/bar/hw/position.change: 315 -> 384 (+69) last pushed server counter
 35- Server performance
 36                      mean     median  count  minimum  maximum  1%   10%     90%    99%
 37 Event Gaps [ms]  100.49±0.04  100.31    70    100.19   101.30      100.22  101.01
 38  Push Time [μs]   47.11±2.03  40.00     70    25.00    122.00      31.00   64.90
 39----------------------------------------dserver/MyServer/top (from foo/bar/top)-----------------------------------------
 40- Received events and callback changes
 41        foo/bar/hw/position.idl5_change: 276 -> 309 (+33) events processed
 42                                       : 276 -> 309 (+33) last received server counter
 43- Client performance
 44                                    mean     median  count  minimum  maximum  1%   10%     90%    99%
 45               Event Gaps [ms]  300.86±0.06  300.71    32    300.39   301.61      300.47  301.41
 46               Sleep Time [μs]   26.22±2.36  20.00     32    16.00    74.00       16.30   46.70
 47                   Latency [s]   7.11±0.33    7.11     32     4.01    10.22        4.47    9.76
 48              Callbacks called   1.00±0.00    1.00     32     1.00     1.00        1.00    1.00
 49                    Wake Count   1.03±0.03    1.00     32     1.00     2.00        1.00    1.00
 50 position Processing Time [ms]  300.86±0.07  300.78    32    300.30   301.57      300.45  301.50
 51===============================================2026-03-17T12:42:31.927772===============================================
 52
 53
 54
 55===============================================2026-03-17T12:42:41.937550===============================================
 56-----------------------------------------dserver/MyServer/hw (from foo/bar/hw)------------------------------------------
 57
 58----------------------------------------dserver/MyServer/top (from foo/bar/top)-----------------------------------------
 59- Received events and callback changes
 60        foo/bar/hw/position.idl5_change: 309 -> 343 (+34) events processed
 61                                       : 309 -> 343 (+34) last received server counter
 62- Client performance
 63                                    mean     median  count  minimum  maximum  1%   10%     90%    99%
 64               Event Gaps [ms]  300.91±0.06  300.89    33    300.34   301.70      300.48  301.36
 65               Sleep Time [μs]   29.21±3.29  25.00     33    14.00    103.00      16.40   57.60
 66                   Latency [s]   13.82±0.33  13.82     33    10.62    17.03       11.10   16.55
 67              Callbacks called   1.00±0.00    1.00     33     1.00     1.00        1.00    1.00
 68                    Wake Count   1.03±0.03    1.00     33     1.00     2.00        1.00    1.00
 69 position Processing Time [ms]  300.86±0.07  300.80    33    300.31   301.66      300.45  301.33
 70===============================================2026-03-17T12:42:41.937550===============================================
 71
 72
 73
 74===============================================2026-03-17T12:42:51.947066===============================================
 75-----------------------------------------dserver/MyServer/hw (from foo/bar/hw)------------------------------------------
 76
 77----------------------------------------dserver/MyServer/top (from foo/bar/top)-----------------------------------------
 78- Received events and callback changes
 79            foo/bar/hw/mode.idl5_change: 2 -> 1 (-1) callbacks
 80        foo/bar/hw/position.idl5_change: 343 -> 376 (+33) events processed
 81                                       : 343 -> 376 (+33) last received server counter
 82- Client performance
 83                                    mean     median  count  minimum  maximum  1%   10%     90%    99%
 84               Event Gaps [ms]  300.83±0.08  300.60    32    300.37   302.10      300.50  301.57
 85               Sleep Time [μs]   32.22±5.24  20.00     32    14.00    171.00      16.30   63.60
 86                   Latency [s]   20.54±0.33  20.54     32    17.43    23.64       17.89   23.18
 87              Callbacks called   1.00±0.00    1.00     32     1.00     1.00        1.00    1.00
 88                    Wake Count   1.06±0.04    1.00     32     1.00     2.00        1.00    1.00
 89 position Processing Time [ms]  300.77±0.08  300.57    32    300.31   302.07      300.43  301.47
 90===============================================2026-03-17T12:42:51.947066===============================================
 91
 92
 93
 94===============================================2026-03-17T12:43:01.955012===============================================
 95-----------------------------------------dserver/MyServer/hw (from foo/bar/hw)------------------------------------------
 96
 97----------------------------------------dserver/MyServer/top (from foo/bar/top)-----------------------------------------
 98- Received events and callback changes
 99            foo/bar/hw/mode.idl5_change: 5 -> 6 (+1) events processed
100                                       : 5 -> 6 (+1) last received server counter
101        foo/bar/hw/position.idl5_change: 376 -> 384 (+8) events processed
102                                       : 376 -> 384 (+8) last received server counter
103- Client performance
104                                    mean     median  count  minimum  maximum  1%  10%  90%  99%
105               Event Gaps [ms]  301.05±0.17  300.92    9     300.52   301.95
106               Sleep Time [μs]   22.78±1.94  20.00     9     14.00    31.00
107                   Latency [s]   24.84±0.17  24.84     9     24.04    25.65
108              Callbacks called   1.00±0.00    1.00     9      1.00     1.00
109                    Wake Count   1.00±0.00    1.00     9      1.00     1.00
110     mode Processing Time [μs]  126.00±0.00  126.00    1     126.00   126.00
111 position Processing Time [ms]  301.08±0.18  300.98    8     300.50   301.93
112===============================================2026-03-17T12:43:01.955012===============================================
Consider the second snapshot (lines 30-51), we can see that in this 10 second period 69 position events were sent by the dserver/MyServer/hw device server with ~100 ms gap between each event (Event Gaps). In other words, these events are being sent at a rate of 10 Hz. However, on the client side we can see that the dserver/MyServer/top device server has a ~300 ms gap between events being processed (Event Gaps), reinforcing what we already knew; the client is only managing to process events at 3 Hz and so cannot keep up. We can also see that the issue is caused by the processing of the position events, which is taking ~300 ms per event (position Processing Time).
Another interesting statistic to look at here is the event latency (Latency), this is the delay between the event being sent by the server and the event starting to be processed by the client. In our case, this statistic is telling us what we already knew; there is a long delay (up to ~25s in the final snapshot) on events being processed. This is ultimately why our Scan() command timed out. It wasn’t that the event was missed by the Tango event system, but rather the processing of the event was delayed.
Warning
The Latency measurement is potentially comparing timestamps from different clocks, one used by the server process and one used by the client process. If these processes are on different machines, these clocks might not be in sync. Typically, this will result in a systematic bias in the measurement meaning absolute numbers should be taken with a grain of salt, however, this bias should not influence any changes to the latency you see.
Note
The Wake Count measurement is not relevant for us here, however, it could be important in other scenarios. This measurement is counting the number of times the event processing thread was woken up while waiting for the event. A value greater than one means that the thread is being woken up to do something other than process events. Typically, if this value is much greater than 1 it means the device server is spending a lot of time subscribing to and unsubscribing from event streams. This can potentially introduce delays as events cannot be processed while the client is (un)subscribing to an event stream. The event processing thread has to be woken during the (un)subscription in order to negotiate disabling event processing for this period.
All the evidence we have gathered points to the culprit being the processing of position events, if we look at the code in question the problem is clear:
    def handle_position(self, ev: EventData) -> None:
        """Handle position change events."""
        time.sleep(0.3)
        if not ev.err:
            self._position = ev.attr_value.value
            self.push_change_event("position", self._position)
        else:
            self._position = None
            self.push_change_event("position", 0.0, time.time(), AttrQuality.ATTR_INVALID)
We should not be sleeping in this callback! In this case the fix is easy, however, in more realistic scenarios it perhaps isn’t so straight forward. Writing robust Tango event callbacks has some guidelines about writing Tango event callbacks that avoid the issue we uncovered in this tutorial.
Conclusion
We have managed to track down the performance issue with our control system that was causing it to appear as if an event went missing during our scan. If you are experiencing Tango event system issues with your control system, you probably aren’t experiencing exactly the same performance issue, however, hopefully during the process of diagnosing the issue with this toy control system you have learnt:
How the
server countercan be used to correlate events pushed by the publisher with events processed by the consumerHow the
missed event counterreports how many missed events Tango has detectedHow the
--monitorflag can be used to gather performance statistics from the event system such as theEvent GapsandLatencyHow to detect if frequent subscriptions are introducing delays by monitoring the
Wake CountHow one “rogue” device can delay events for all other devices in the device server by monopolising the event processing thread