Example Usage with EAGLE
In this page we briefly describe how to use JACAL in a DALiuGE graph. This assumes you already built JACAL.
Outline
In this example we will replicate one of the unit tests run in the GitLab CI
pipeline, namely test_basic_imaging. This test performs basic imaging on an
input MeasurementSet using the CalcNE and SolveNE JACAL
components, via the EAGLE web interface.
In DALiuGE a program is expressed as a graph, with nodes listing applications, and the data flowing through them. Graphs come in two flavours: logical, expressing the logical constructs used in the program (including loops, gather and scatter components), and physical, which is the fully-fledged version of a logical graph after expanding all the logical constructs.
This test is expressed as a logical graph. After translation into a physical graph it is submitted for execution to the DALiuGE managers, which were started by running the docker containers during installation. During execution one can monitor the progress of the program. This is all handled via a browser using EAGLE.
Preparing the Graph
For this test you will need to download the JSON logical graph. and the input dataset. When running Yandasoft applications, one typically provides a text file known as a parset containing configuration options. However this graph uses a DALiuGE drop to provide the configuration options. First, download the graph to a local directory:
$> wget https://gitlab.com/ska-telescope/ska-sdp-jacal/-/raw/master/jacal/test/daliuge/test_basic_imaging_parset.json
Running image icrar/daliuge-engine:jacal generates a temporary work
directory that is accessible both inside and outside the docker container:
$> ls -l /tmp/.dlg
code/
logs/
testdata/
workspace/
The graph assumes that the dataset is located in the testdata directory, so place it there:
$> cd /tmp/.dlg/testdata
$> wget https://gitlab.com/ska-telescope/ska-sdp-jacal/-/raw/master/data/chan_1.ms.tar.gz
$> tar xf chan_1.ms.tar.gz
The final assumption in the graph is the specificatin of the JACAL library
within the deocker container, which is set to /usr/local/lib/libjacal.so.
Inspecting and Editing the Graph
Deploying a Graph Locally
After installation on the local host, the DALiuGE
translator will be connected to port 8084 and EAGLE to port 8888. Open a
browser and go to http://localhost:8888/. This will bring up the EAGLE
visual workspace. From the Graph drop-down menu, select Local Storage and
then Load Graph. Navigate to test_basic_imaging_parset.json and load it into
the browser.
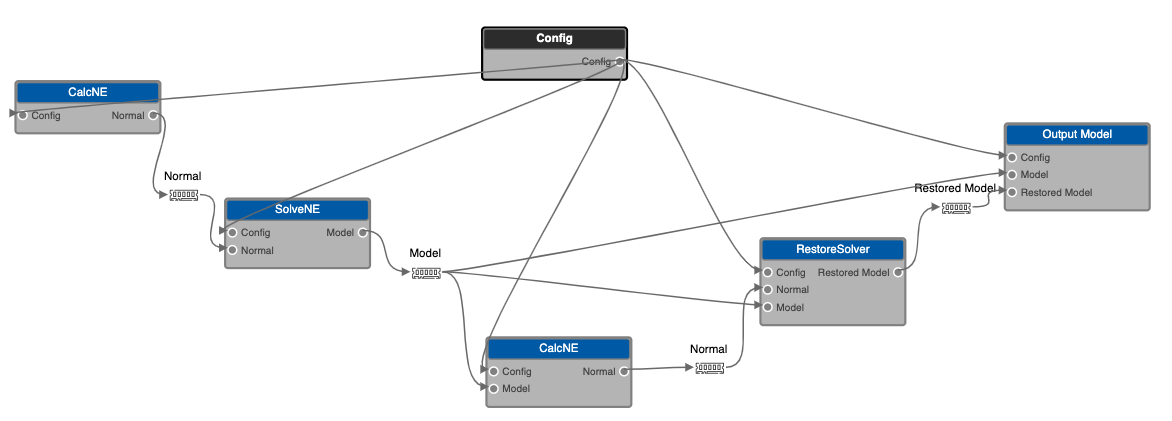
This graph performs imaging with a single major cycle of deconvolution. The graph is just for demonstration and the cleaning is not very deep. See the imaging overview for more details. Clicking on each component brings up an Inspector in the right-hand panel that can be used to read and edit run-time parameters. Of particular interest are Component Parameters and I/O Ports. The Config component generates imaging parset, and imaging parameters can found by inspecting its Component Parameters.
Note
To edit Component Parameters some of the Advanced Editing setting may need to be altered via the cog in the top right corner.
Before translating and deploying the graph, a few options need to be
configured. The most important is the location of the EAGLE translator. The cog
in the top right corner brings up EAGLE configuration settings, and under
External Services is the Translator URL box. Set this to
http://localhost:8084/gen_pgt, the local translator running in the container
with port 8084 forwarded from the localhost. Setting GitHub and GitLab Access
Tokens can also be done under External Services, allowing EAGLE to access
various repositories.
The logical graph is now ready to be partitioned into a physical graph. From
the Translation tab in the right-hand panel, select Generate PGT to
generate a Physical Graph Template that can be mapped to compute nodes.
This should open the DALiuGE translator interface in a new browser tab.
Click on the Translator settings cog and check the DALiuGE Manager
URL. This should be set to port 8001 of the actual IP address, e.g.
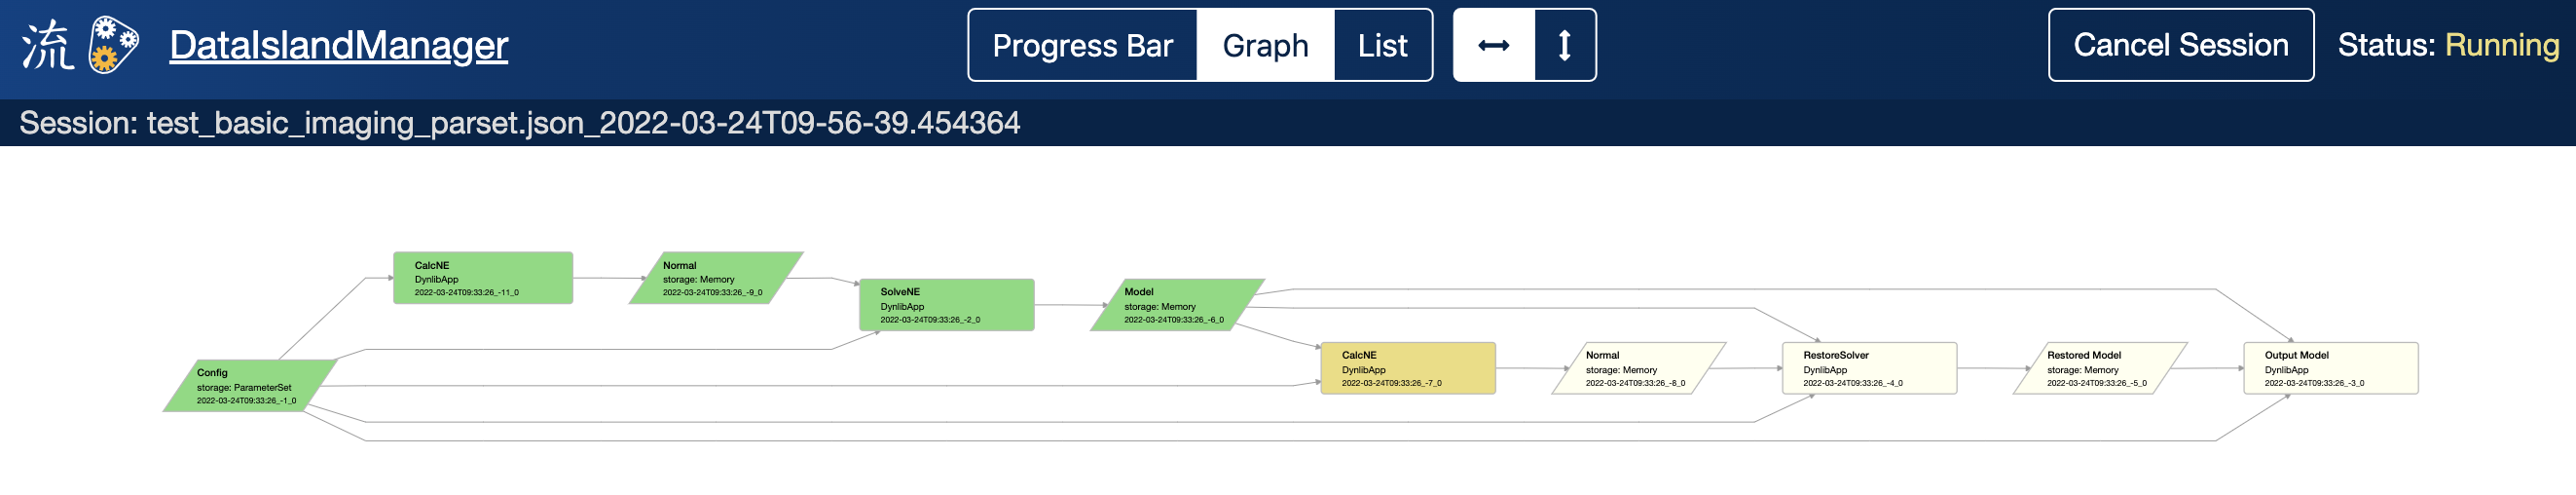
http://130.155.199.71:8001/. Now select Deploy to generate and deploy the
physical graph. This brings up a new browser tab which displays the progress of
the graph.
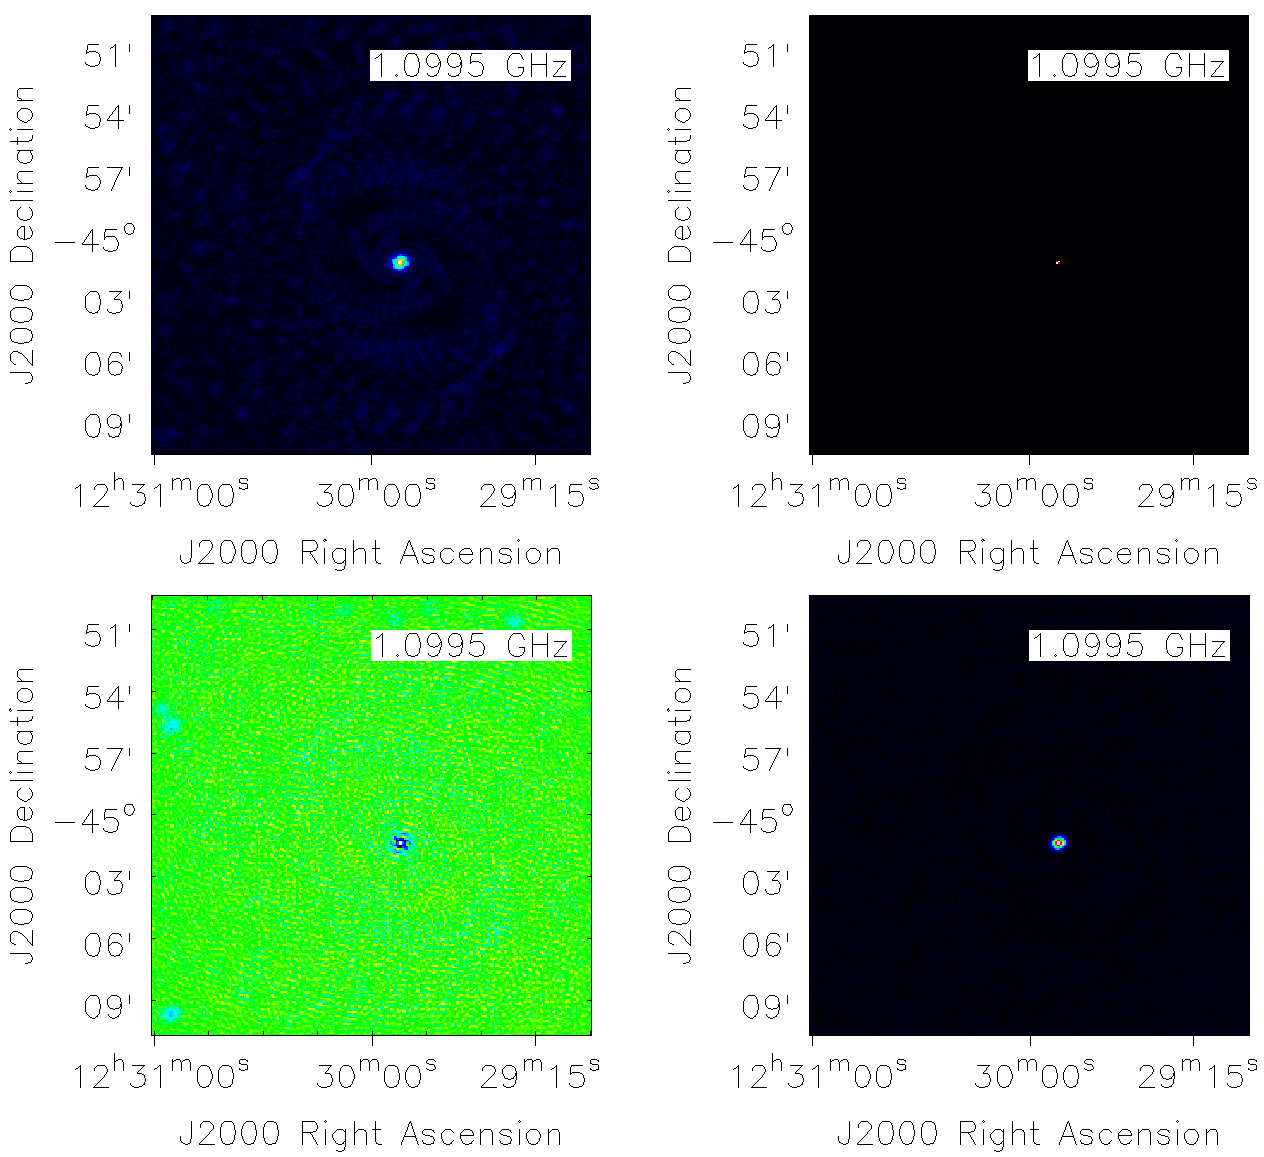
When the graph has completed, the resulting images can be found in
/tmp/.dlg/workspace. These are shown in the following figure. From the top
left is the initial dirty image, the clean component image, the residual image
and the restored image.
Runtime logs can be displayed via docker:
$> docker logs daliuge-engine
Deploying a Graph Remotely
Same as above but point to hostname or IP address rather than localhost.
Deploying a Graph on a Cluster
Todo