Compute Resource Requirements
Memory requirements
In the section Recombination parameters, the table contains the image sizes of various possible inputs. We should have a cumulative memory on all compute nodes of at least the size of the image. We are also using limited sized Queue parameters and buffers in the benchmark. These queue sizes are configurable and therefore, we should pay attention to the memory available before altering these queue sizes.
The following table gives the average and maximum memory used for different image sizes.
Antenna config |
Image |
Avg. cumulative memory used (GB) |
Max. cumulative memory used (GB) |
|
16k-8k-512 |
82 |
90 |
32k-8k-1k |
120 |
160 |
|
64k-16k-1k |
193 |
276 |
|
96k-12k-1k |
380 |
462 |
|
128k-32k-2k |
707 |
913 |
|
256k-32k-2k |
2626 |
2925 |
|
|
16k-8k-512 |
87 |
90 |
32k-8k-1k |
115 |
156 |
|
64k-16k-1k |
176 |
266 |
|
96k-12k-1k |
360 |
440 |
|
128k-32k-2k |
560 |
914 |
|
256k-32k-2k |
2437 |
2612 |
These tests are made using 30 nodes with the following hardware on each compute node:
2 Intel(R) Xeon(R) Gold 6130 CPU @ 2.10GHz, 16 cores/CPU with hyperthreading enabled
192 GB RAM
1 x 10 Gb Ethernet, 1 x 100 Gb Omni-Path
Each run follows the configuration given in SKA1 LOW and MID settings for lowbd2 and midr5 settings. Number of facet workers and eventually, number of MPI processes are chosen according to the number of facets for each image that can be found in Recombination parameters.
These numbers are only approximate as they include the memory usage by the system resources as well. But this gives an idea of the memory requirements for different image sizes. We only used dry runs, i.e., not writing visibility data to the disk, to obtain these numbers. In the non-dry runs we should take into account the visibility queues that will require additional memory. Note that as stated in Recombination parameters, 256k-32k-2k is not suited to run for lowbd2 configuration. The memory requirements are provided here only for the reference purposes.
Run times
The runtimes obtained from both dry and non-dry runs from the benchmarking tests on JUWELS are shown below.
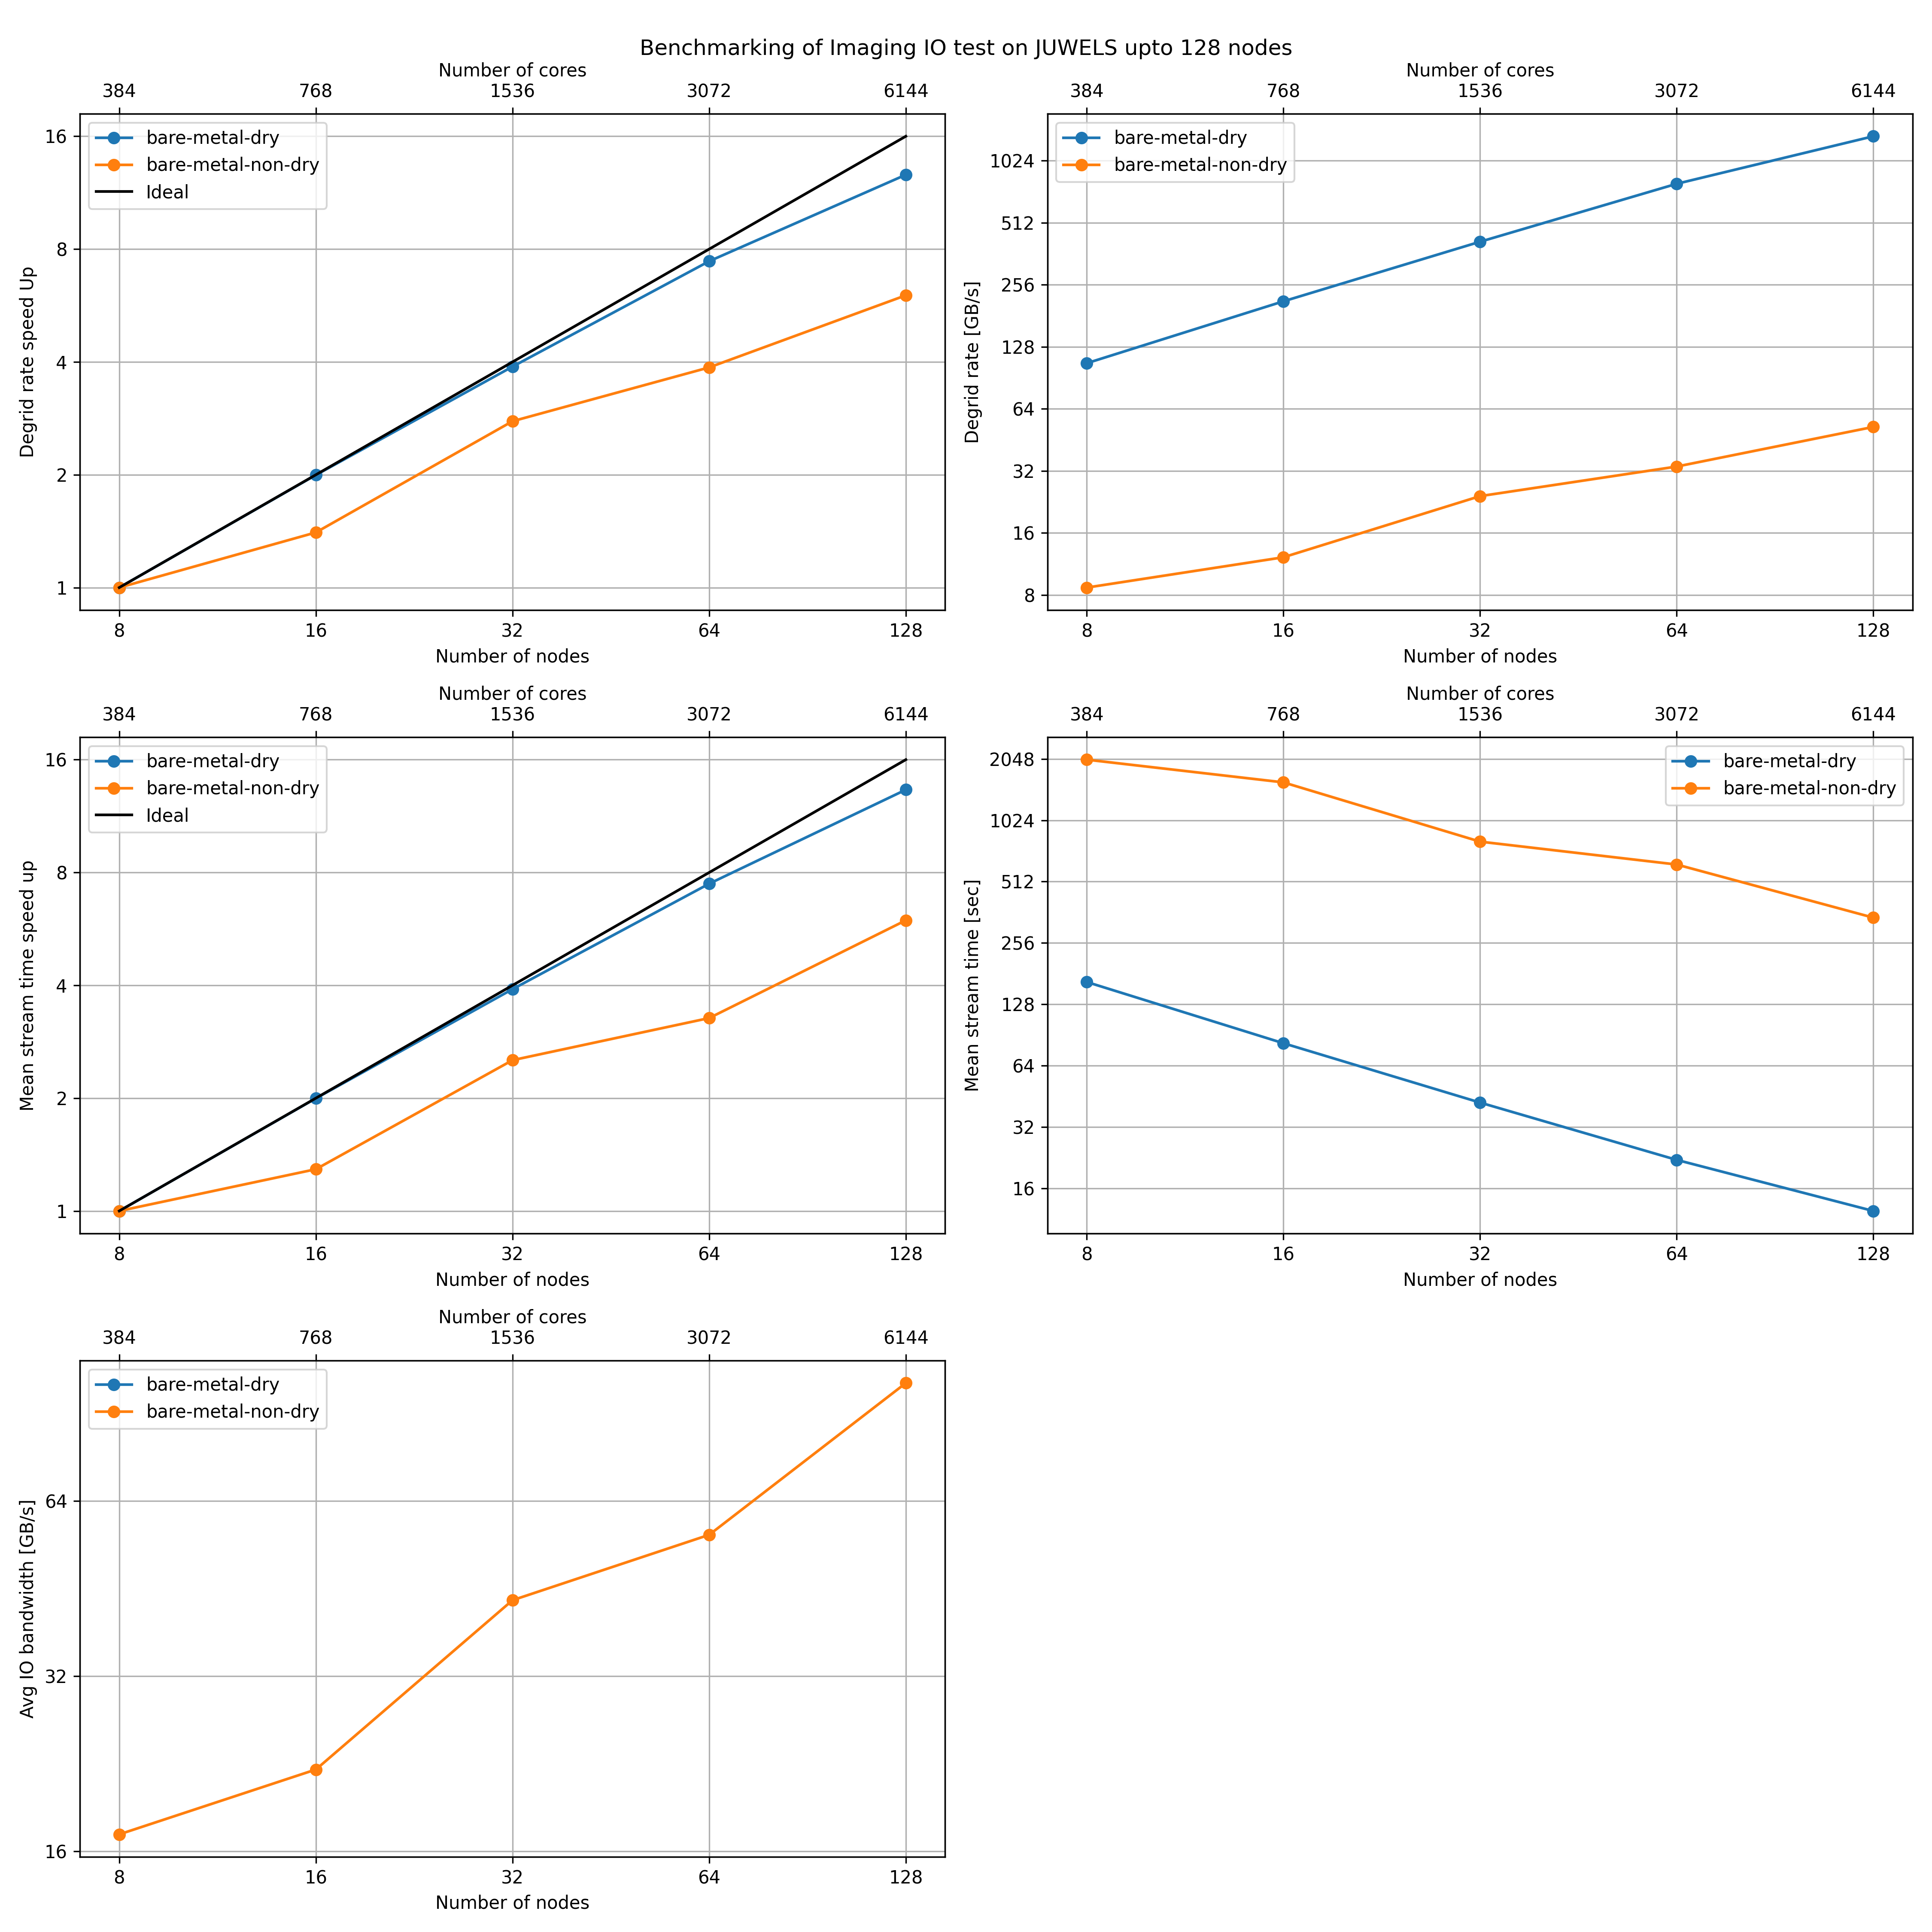
This gives a reference run times of the benchmark code using 384 to 6144 cores. The actual run time is in the order of the mean stream time plus MPI start up and pre configuration overheads. No sever load balancing issues were observed for the runs. The above runtime values for the dry runs can be considered as a good reference for running the prototype.
Notice that the case of runtimes for non-dry runs heavily depend on the I/O bandwidth offered by the underlying parallel file system. Care should be taken when launching such runs as they can overload the file system cluster. In the case shown, we obtained an I/O bandwidth around 100 GB/s, where the prototype generated more than 32 TB of data. When running on the clusters that offers inferior throughputs, reservation time should be estimated accordingly based on the amount of data the prototype will generate and available I/O bandwidth. The approximate amount of data that would be generated for different configurations are presented in SKA1 LOW and MID settings. It is also worth noting that the bigger chunk sizes result in more data. For instance, for the configuration used for JUWELS runs, we should expect a visibility data around 17 TB. But we ended up writing more than 32 TB of data because we used relatively bigger chunks of 1 MiB for these runs. The exact amount of data produced cannot be estimated a priori, but for the chunk size of 1 MiB, a factor of 2 seems to be a good estimation.