Mono-node example
This example demonstrates how to use the benchmon tool to monitor and analyze the performance of a single-node system while running a series of computational and I/O benchmarks. The script starts by configuring and launching benchmon with various monitoring options, including system metrics, power consumption, and call stack tracing. It then executes two computational benchmarks (lu.C.x and ft.D.x), followed by I/O benchmarks using fio on both local and NFS storage. After the benchmarks complete, benchmon is stopped, and visualization commands are provided to generate detailed performance plots for further analysis.
| Number of nodes | 1 |
|---|---|
| CPU Model | AMD EPYC 7642 |
| CPUs | 1 |
| Cores per CPU | 48 |
| Threads per core | 1 |
| Memory | 512 GiB |
| Network | IB 100 Gbps |
| Disk | SSD NVME |
#!/usr/bin/bash


### benchmon start ################################################################################
save_dir="./traces_doc_mono_$(date +%s)"
benchmon_params="--save-dir $save_dir"
benchmon_params+=" --sys --sys-freq 10"         # System monitoring with 10Hz frequency
benchmon_params+=" --power"                     # Power monitoring with perf
benchmon_params+=" --pow-g5k"                   # Power monitoring with Grid5000
benchmon_params+=" --call --call-prof-freq 10"  # Callstack tracing with 10Hz frequency
benchmon_params+=" --verbose"                   # Enable verbosity
benchmon-start $benchmon_params
###################################################################################################


### run apps ######################################################################################
interval=15 # Interval between each benchmark
sleep $interval

export OMP_NUM_THREADS=$(nproc)

# LU benchmark
./lu.C.x

sleep $interval

# FT benchmark
./ft.D.x

# Params of IO benchmarks
njobs=$(nproc)
nrfiles=4
fsize=2G

# Local storage read and write
local_tmpdir=$(mktemp -dp /tmp)
fio --name=fio_test --ioengine=sync --rw=write --bs=1M --size=$fsize --numjobs=$njobs --nrfiles=$nrfiles --directory=$local_tmpdir
fio --name=fio_test --ioengine=sync --rw=read --bs=1M --size=$fsize --numjobs=$njobs --nrfiles=$nrfiles --directory=$local_tmpdir

sleep $interval

# NFS storage read and write
nfs_tmpdir=$(mktemp -dp ~/storage-lyon.link/tmp/)
fio --name=fio_test --ioengine=sync --rw=write --bs=1M --size=$fsize --numjobs=$njobs --nrfiles=$nrfiles --directory=$nfs_tmpdir
fio --name=fio_test --ioengine=sync --rw=read --bs=1M --size=$fsize --numjobs=$njobs --nrfiles=$nrfiles --directory=$nfs_tmpdir

sleep $interval
###################################################################################################


### benchmon stop #################################################################################
benchmon-stop
###################################################################################################


### benchmon visu #################################################################################
benchmonvisu_params="--verbose --fig-fmt png --fig-name myfigure"   # Enable versbosity and set figure format and name
benchmonvisu_params+=" --cpu --cpu-all --cpu-freq"                  # Dispplay CPU usage, all cores and frequencies
benchmonvisu_params+=" --net --net-all --net-data"                  # Display network activity for all interfaces and data
benchmonvisu_params+=" --mem"                                       # Display memory and swap usage
benchmonvisu_params+=" --disk --disk-data --disk-iops"              # Display disk activity and IOPS
benchmonvisu_params+=" --pow"                                       # (Perf) Display power profiles and energy consumption
benchmonvisu_params+=" --pow-g5k"                                   # (G5k) Display power profiles and energy consumption
benchmonvisu_params+=" --inline-call"                               # Annotate plots with running commands
benchmonvisu_params+=" --recursive"                                 # Generate synchronized plots for multi-node runs
benchmon-visu $benchmonvisu_params $save_dir
###################################################################################################
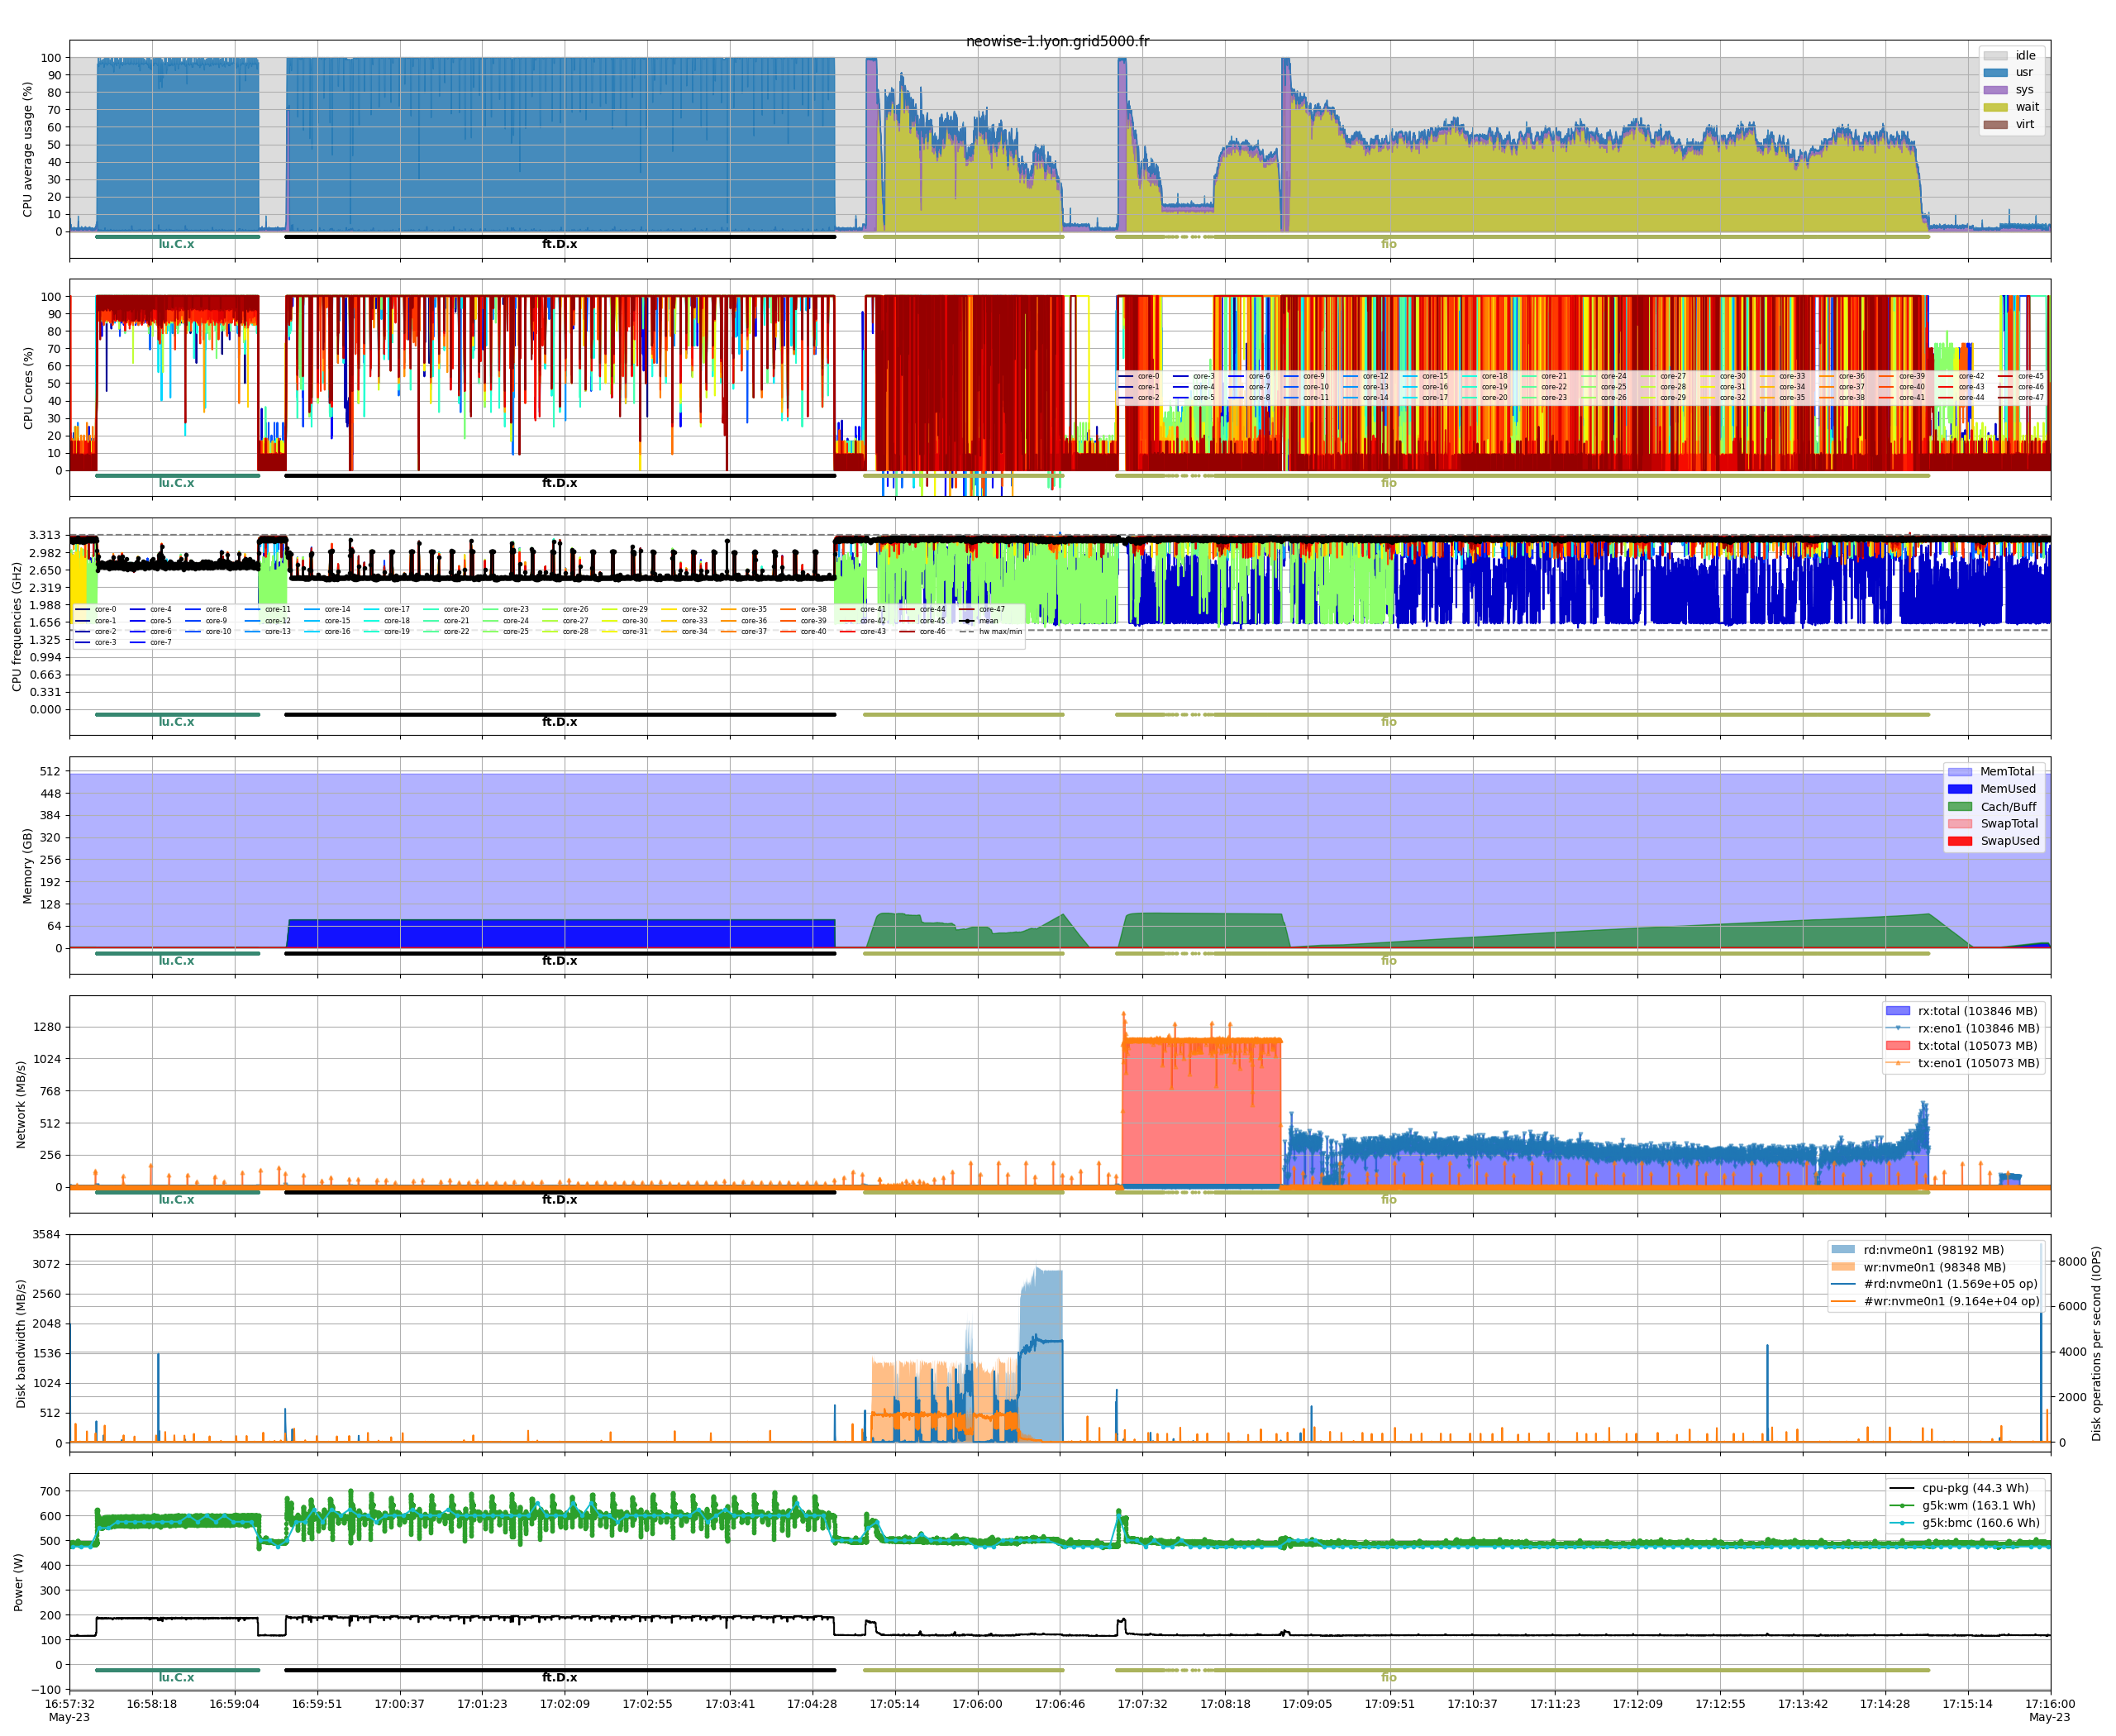
The figure generated by benchmon illustrates the system’s behavior during the benchmarks. For the two computational benchmarks, ft.D.x and lu.C.x, the CPU usage reaches full capacity, reflecting their efficient optimization. The I/O benchmarks performed with fio highlight increased CPU wait times during I/O operations. This activity is visible in the disk graph for the local storage benchmark, while the network interface graph shows the activity for the NFS-based benchmark, as data is transferred over the network. The power consumption graph indicates higher energy usage during the computational benchmarks and lower consumption during the I/O benchmarks, since the latter are less CPU-intensive.