Activity Dashboard
The Activity Dashboard allows users to visualize and explore activity data across various entities and projects within a selected time range. It provides multiple interactive plots and a detailed project list to help users analyze progress, identify trends, and gain insights efficiently.
Accessing the Dashboard
To access the Activity Dashboard, click on the  button from the Home page.
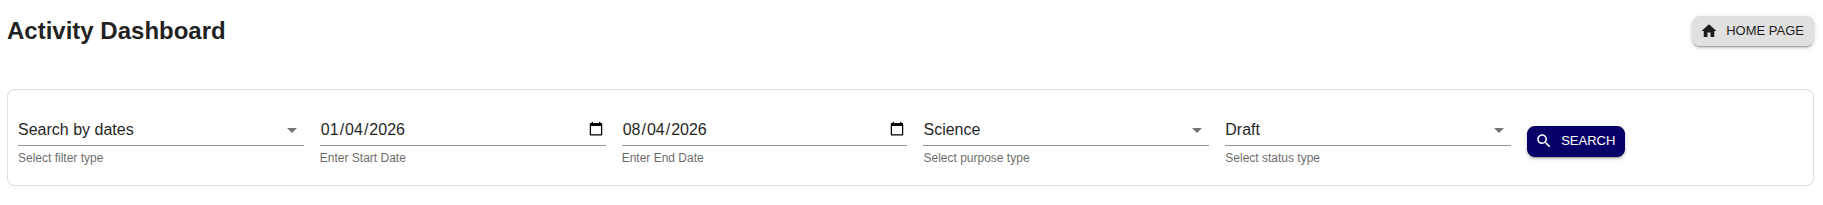
Selecting Date Range
On the Activity Dashboard page, users can:
Select a Start Date and End Date using the date pickers available on the UI.
Click the  button to load the dashboard plots and project lists for the selected date range.
After clicking Search, the dashboard will display multiple interactive plots representing different entities, along with a tabular Project List summary.
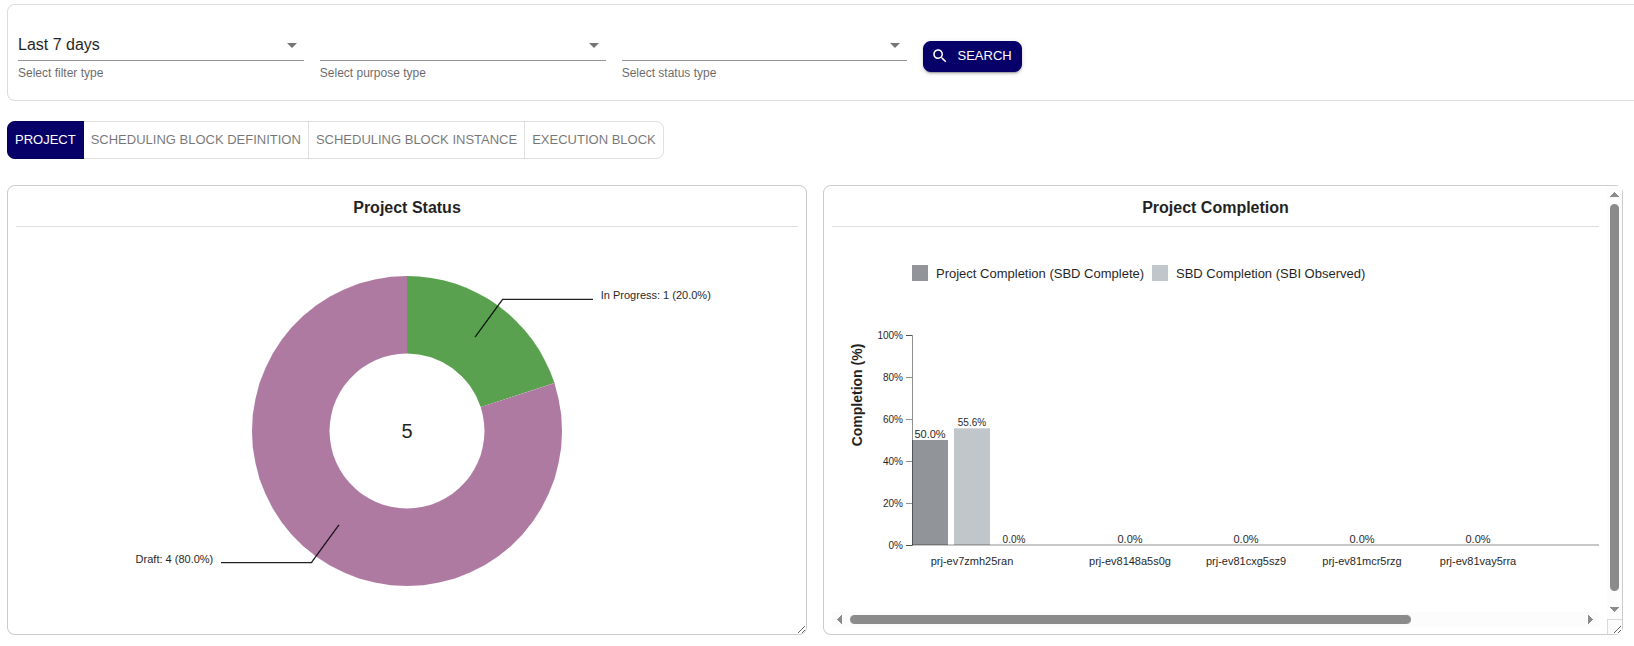
Filtering Plots
Users can customize their dashboard view by selecting specific entities using the filters available on the UI. Each selected entity (e.g., Project, SBD, SBI, EB) will generate a corresponding plot as shown in the following examples.
Project plot
The Project Plot displays the number of projects categorized by their current status.
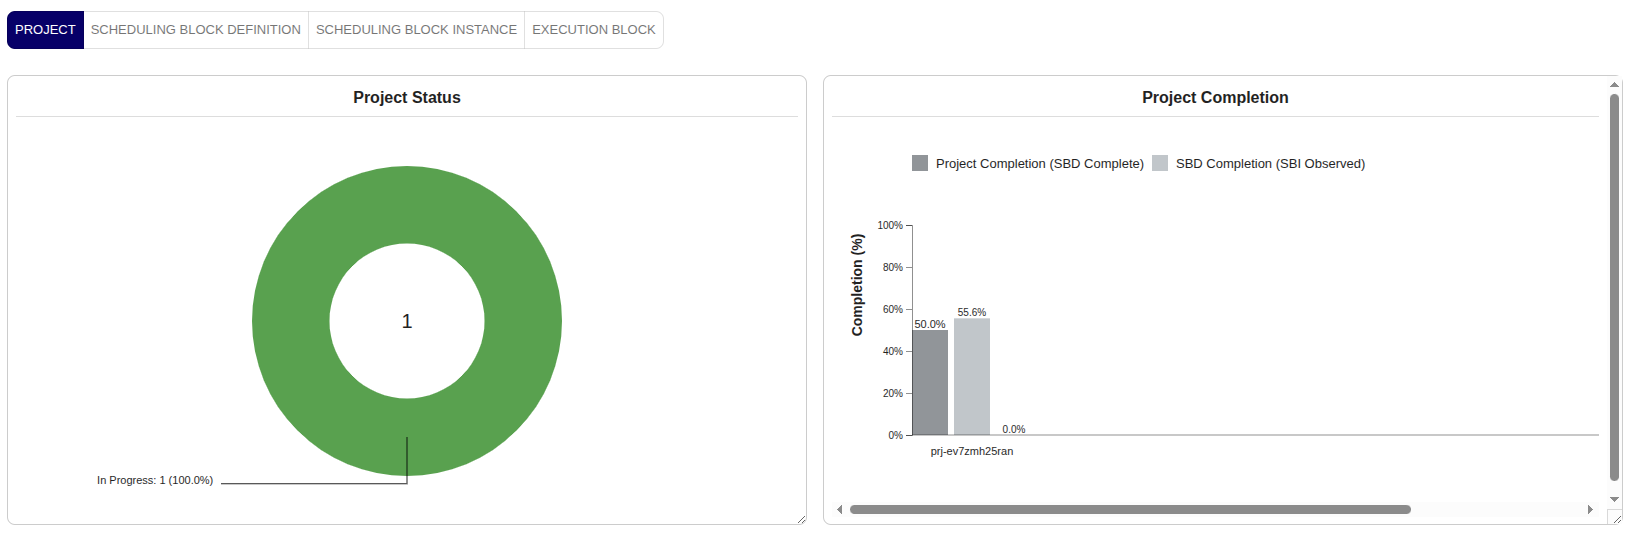
Users can click on any status category (e.g., In Progress, Completed, Cancelled) to drill down and view the detailed project list for that specific status.
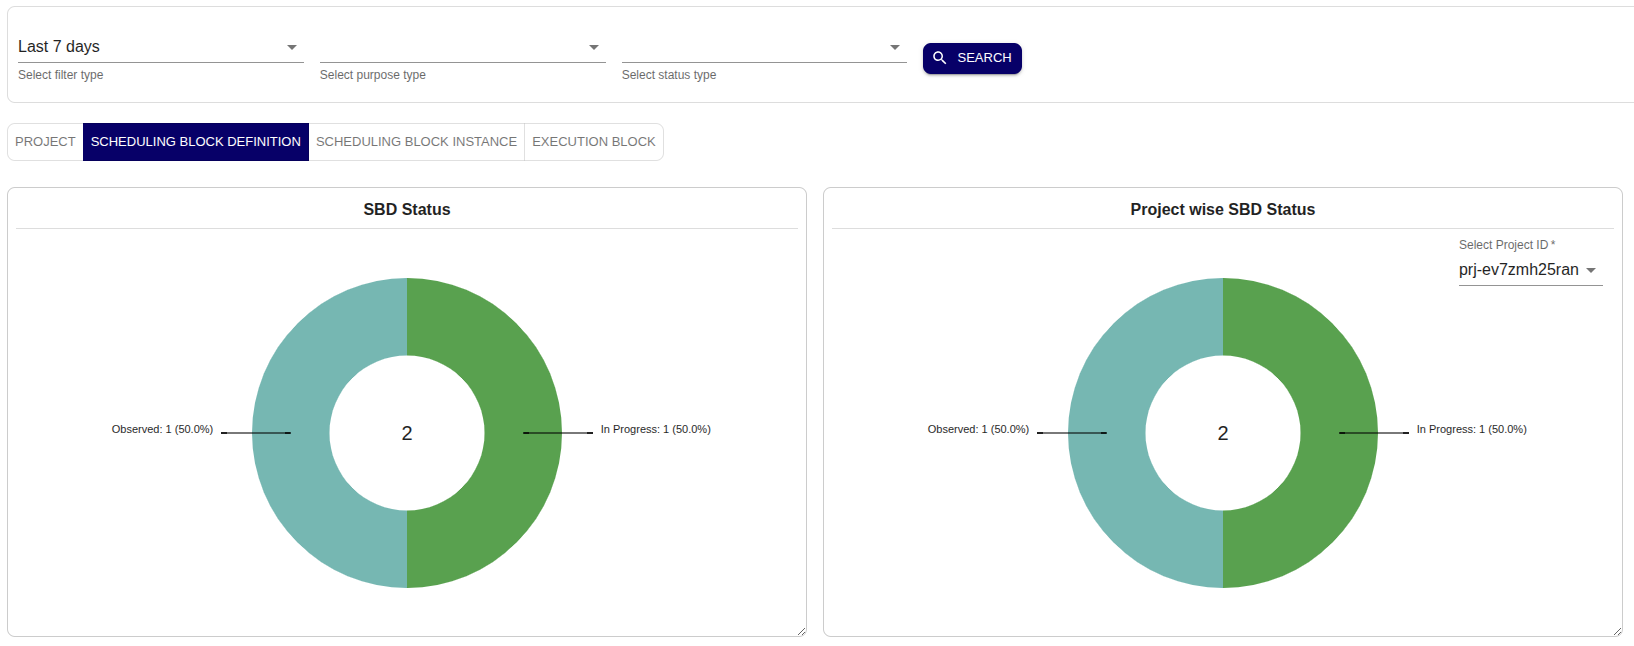
SBD plot
The SBD Plot shows the distribution or progress of Scheduling Block Definitions (SBDs) within the selected date range.
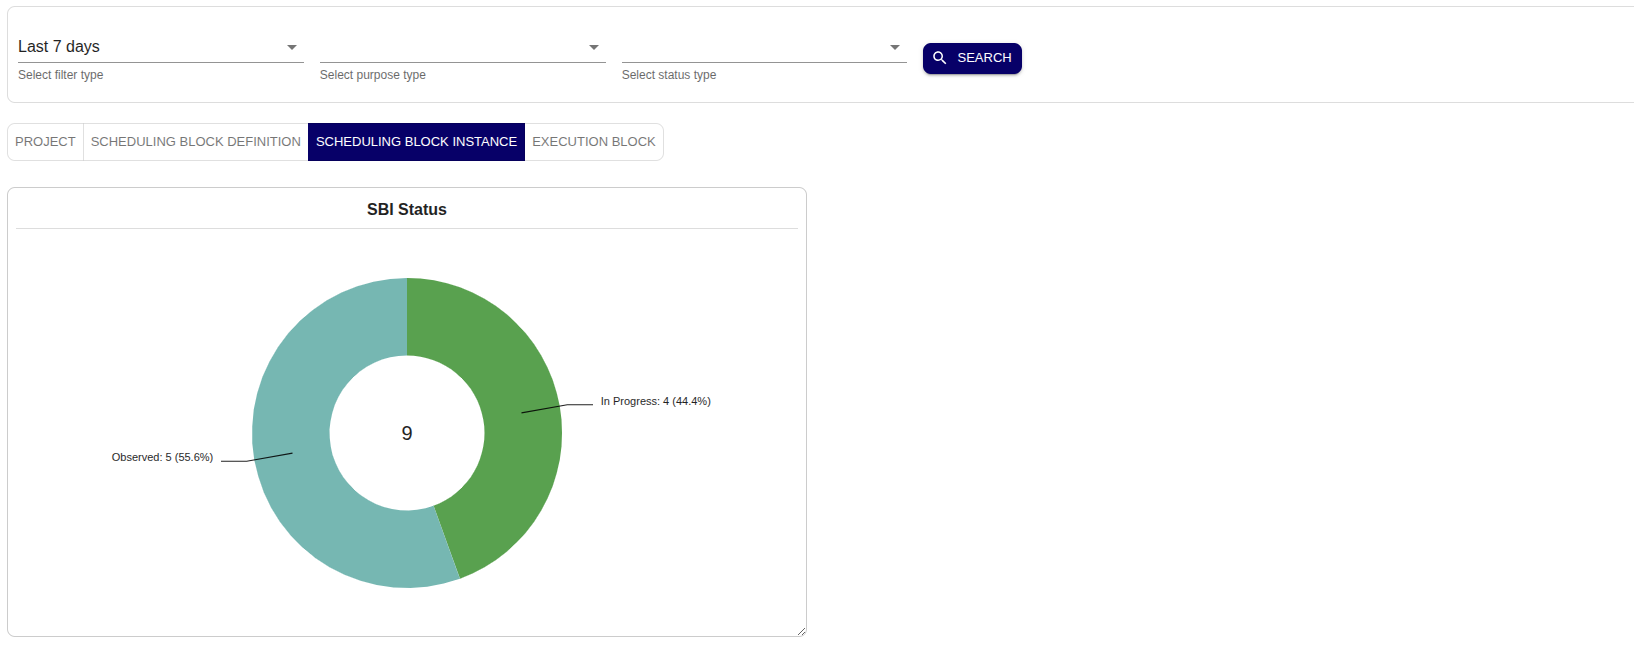
SBI plot
The SBI Plot visualizes the activity and status of Scheduling Block Instances (SBIs) during the selected time period.
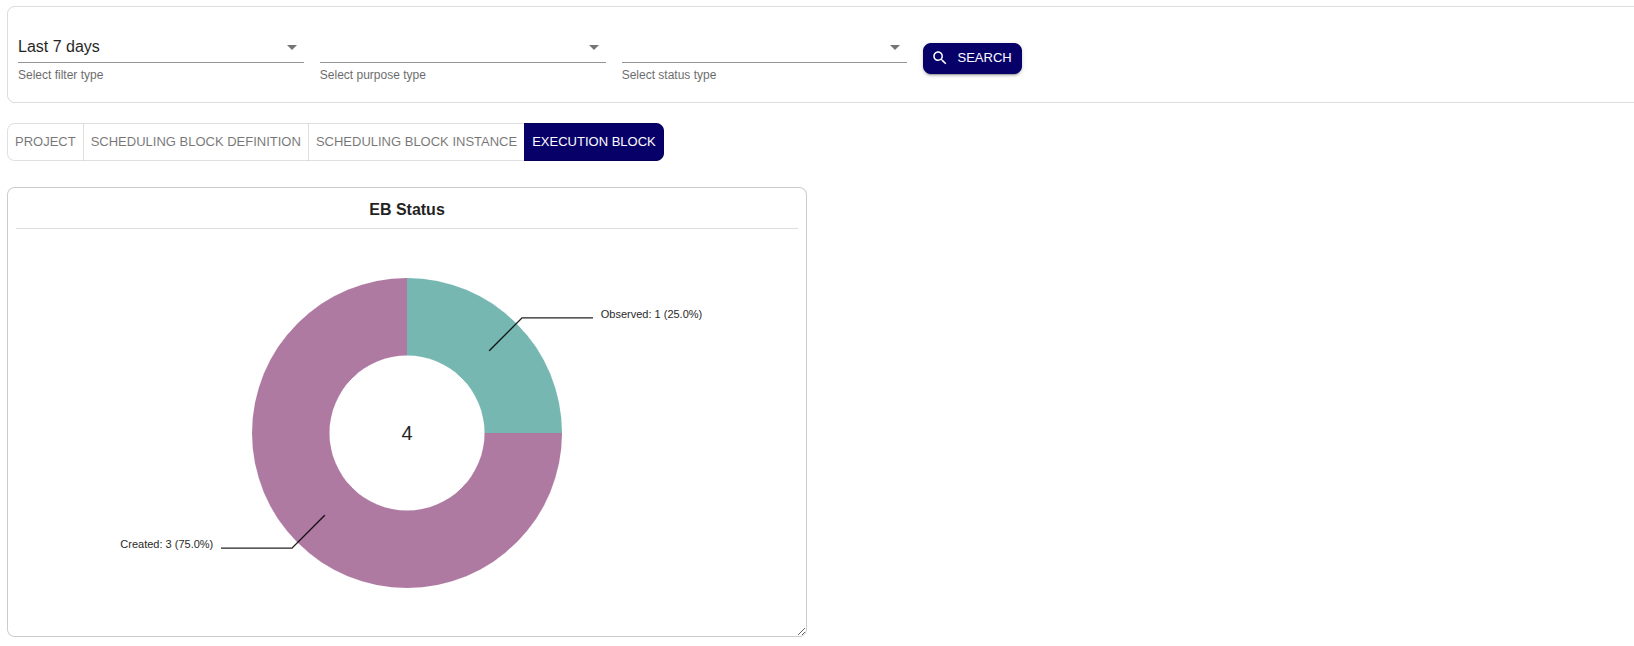
EB plot
The EB Plot represents the Execution Blocks (EBs) and their corresponding status, helping users track operational activities in detail.
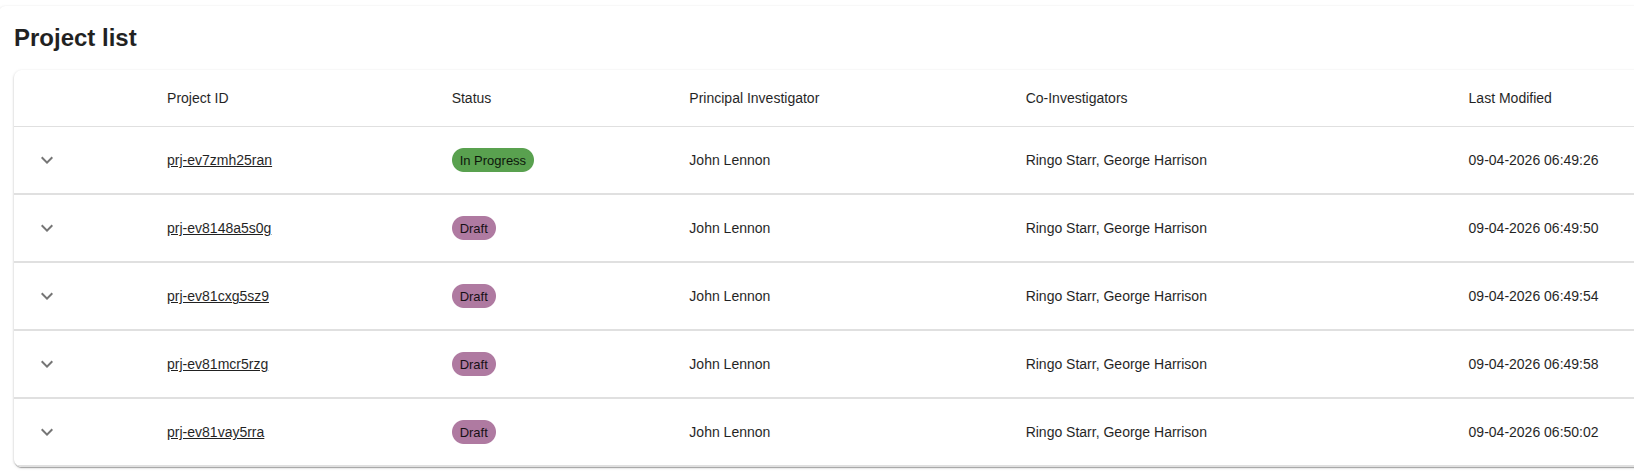
Project list
Below the plots, a comprehensive Project List table is displayed, containing all relevant projects for the selected date range and filters.
Project details
Users can click on any project entry within the Project List to open detailed project information.
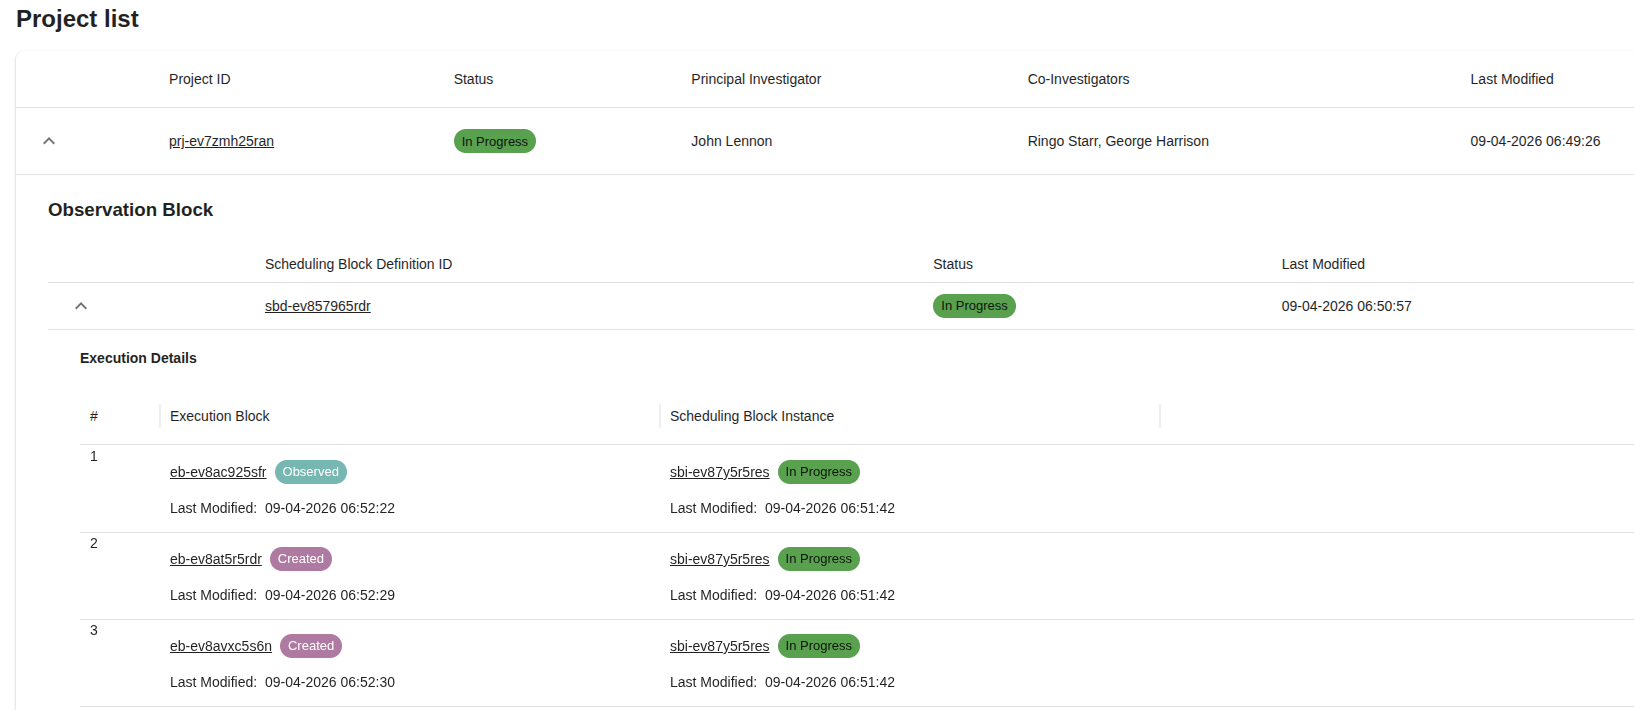
The Project Details view includes additional insights such as entity breakdowns (SBDs, SBIs, EBs), activity progress, and operational metadata.