Timeline Widget
Welcome to the Timeline Widget docs.
Summary
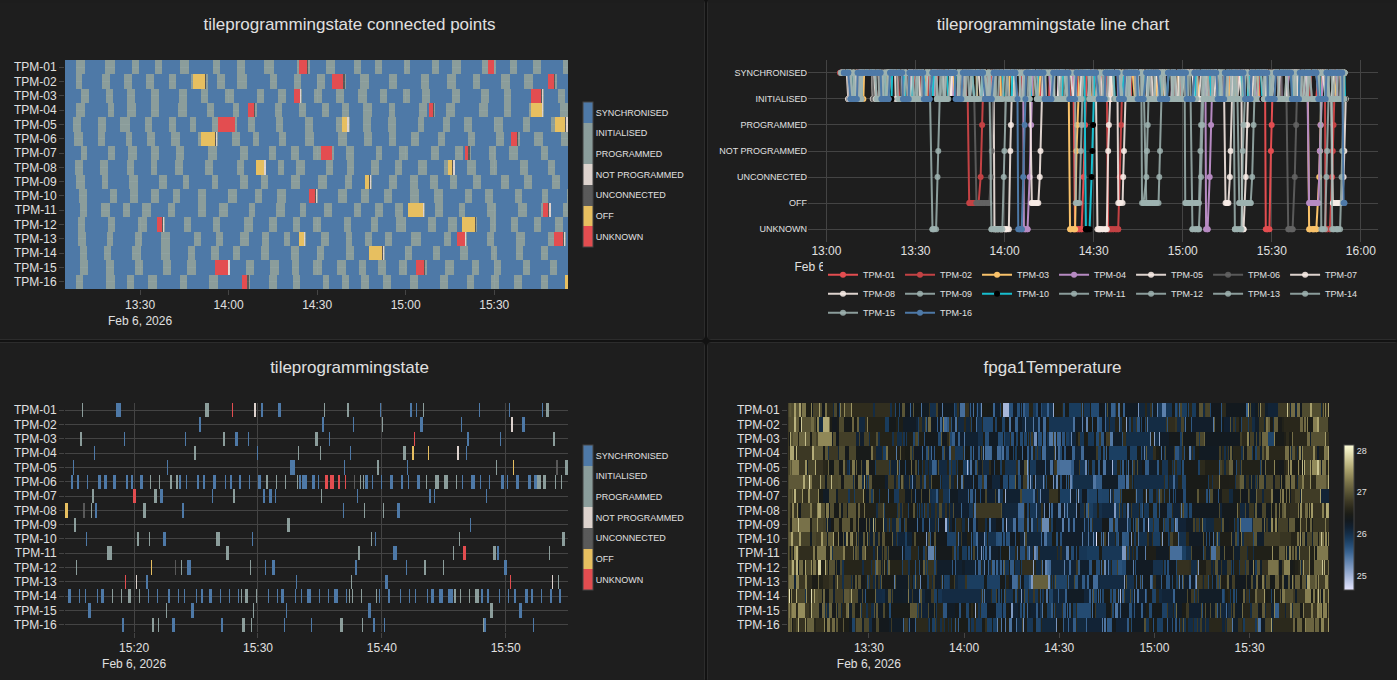
The Timeline Widget visualizes Tango attribute values across time using the same HDB++ history and live-stream core used by the HDBPP Live widget.
It is designed for operational monitoring where you need to:
track recent behavior of multiple attributes in one plot
switch between historical windows and live updates
detect value changes, missing data, and attribute outliers quickly
When to use this widget
Use the Timeline Widget when you want a time-oriented operational view of many attributes, especially for station/device status monitoring.
Typical use cases:
monitor TPM programming state or temperature trends across a station
compare the same attribute across many devices over the same time range
watch live transitions while keeping historical context
Display modes
Line mode (
barView = false): best for trend inspection and exact value-over-time reading.Bar view (
barView = true): best for dense comparisons across many attributes.
Data sources
History:
hdbppHistoryquery, with optional server-side downsampling.Live:
tangoAttributessubscription, with optional append throttling viaappendInterval.
Overview
- Getting Started
- Architecture
- Configuration Timeline Widget
- Widget Functionality
- Changelog
- 0.7.4 - 2026-06-12
- 0.7.3 - 2026-06-12
- 0.7.2 - 2026-06-12
- 0.7.1 - 2026-06-12
- 0.7.0 - 2026-06-11
- 0.6.8 - 2026-06-11
- 0.6.7 - 2026-06-05
- 0.6.6 - 2026-06-04
- 0.6.5 - 2026-06-04
- 0.6.4 - 2026-06-04
- 0.6.3 - 2026-06-02
- 0.6.2 - 2026-06-02
- 0.6.1 - 2026-06-01
- 0.6.0 - 2026-05-30
- 0.5.5 - 2026-05-20
- 0.5.4 - 2026-05-19
- 0.5.3 - 2026-05-15
- 0.5.2 - 2026-05-15
- 0.5.1 - 2026-05-15
- 0.5.0 - 2026-05-11
- 0.4.22 - 2026-05-07
- 0.4.21 - 2026-05-07
- 0.4.20 - 2026-05-07
- 0.4.19 - 2026-05-05
- 0.4.18 - 2026-05-04
- 0.4.17 - 2026-04-24
- 0.4.16 - 2026-04-23
- 0.4.15 - 2026-04-22
- 0.4.14 - 2026-04-21
- 0.4.13 - 2026-04-21
- 0.4.12 - 2026-04-20
- 0.4.11 - 2026-04-19
- 0.4.10 - 2026-04-19
- 0.4.9 - 2026-04-19
- 0.4.8 - 2026-04-19
- 0.4.7 - 2026-04-17
- 0.4.6 - 2026-04-17
- 0.4.5 - 2026-04-17
- 0.4.4 - 2026-04-16
- 0.4.3 - 2026-04-16
- 0.4.2 - 2026-04-13
- 0.4.1 - 2026-04-13
- 0.4.0 - 2026-04-10
- 0.3.2 - 2026-04-09
- 0.3.0 - 2026-04-06
- 0.2.1 - 2026-03-26
- 0.2.0 - 2026-03-18
- 0.1.65 - 2026-03-16
- 0.1.64 - 2026-03-16
- 0.1.63 - 2026-03-16
- 0.1.62 - 2026-03-16
- 0.1.61 - 2026-03-16
- 0.1.60 - 2026-03-13
- 0.1.59 - 2026-03-13
- 0.1.58 - 2026-02-26
- 0.1.57 - 2026-02-26
- 0.1.56 - 2026-02-26
- 0.1.55 - 2026-02-26
- 0.1.54 - 2026-02-26
- 0.1.53 - 2026-02-26
- 0.1.52 - 2026-02-26
- 0.1.50 - 2026-02-17
- 0.1.49 - 2026-02-13
- 0.1.48 - 2026-02-13
- 0.1.47 - 2026-02-13
- 0.1.46 - 2026-02-11
- 0.1.45 - 2026-02-11
- 0.1.44 - 2026-02-11
- 0.1.43 - 2026-02-11
- 0.1.42 - 2026-02-11
- 0.1.41 - 2026-02-11
- 0.1.40 - 2026-02-11
- 0.1.39 - 2026-02-10
- 0.1.38 - 2026-02-09
- 0.1.37 - 2026-02-09
- 0.1.36 - 2026-02-06
- 0.1.35 - 2026-02-06
- 0.1.29 - 2026-01-21
- 0.1.28 - 2026-01-19
- 0.1.27 - 2025-12-17
- 0.1.26 - 2025-12-15
- 0.1.25 - 2025-12-15
- 0.1.24 - 2025-11-18
- 0.1.23 - 2025-11-17
- 0.1.22 - 2025-11-13
- 0.1.21 - 2025-11-10
- 0.1.20 - 2025-10-02
- 0.1.19 - 2025-10-02
- 0.1.18 - 2025-09-25
- 0.1.17 - 2025-09-18
- 0.1.16 - 2025-09-08
- 0.1.15 - 2025-09-08
- 0.1.13 - 2025-09-01
- 0.1.12 - 2025-08-26
- 0.1.11 - 2025-08-25
- 0.1.10 - 2025-08-21
- 0.1.9 - 2025-08-08
- 0.1.8 - 2025-08-05
- 0.1.7 - 2025-07-30
- 0.1.6 - 2025-07-29
- 0.1.5 - 2025-07-29
- 0.1.4 - 2025-07-29
- 0.1.3 - 2025-07-29
- 0.1.2 - 2025-07-29
- Test Coverage