Low PSI Live Display
Two scripts under scripts/ provide a live, terminal-based view of the
Low PSI FPGA cluster: psi_gather.py collects a JSON snapshot, and
psi_display.py renders it as a colour-coded table. They are intended
for ad-hoc debugging — neither is part of the test suite or CI.
Both consume the network source of truth at
src/ska_low_cbf_integration/data/psi-net.yaml (via
ska_low_cbf_integration.low_psi_net) for FPGA serial → P4 port,
serial → host, and serial → PCIe BDF lookups.
psi_gather.py
Snapshots the Low PSI Kubernetes cluster: discovers FPGA pods (cnic /
processor), records their Tango device names, P4 port assignments,
firmware personality, and routing/throughput state from the connector
device, then writes a JSON document to stdout.
It uses the K8s Python client to enumerate pods and falls back to the
YAML’s static BDF → serial map when xbutil examine is not reachable
inside the pod.
Run it via poetry run from the repo root so the project package is
importable:
poetry run python scripts/psi_gather.py            # JSON to stdout
poetry run python scripts/psi_gather.py > snap.json
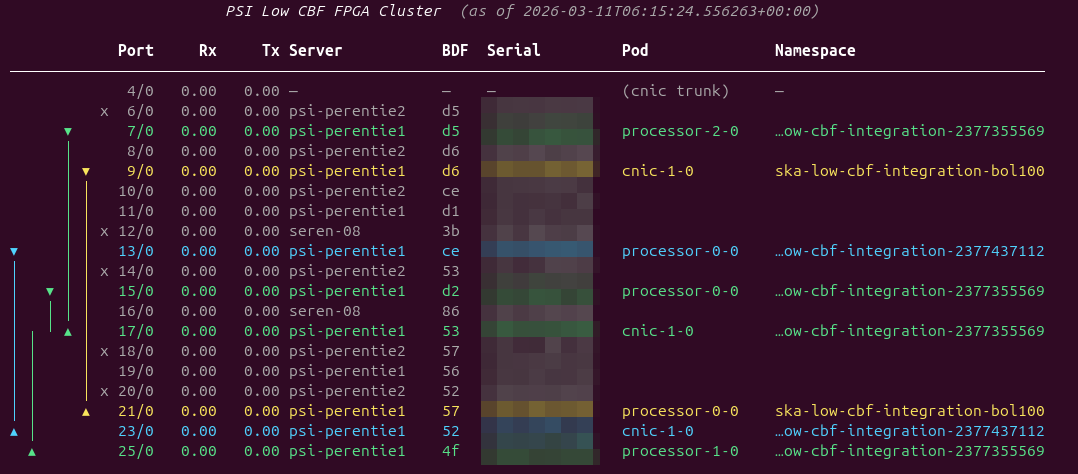
psi_display.py
Renders a snapshot as a rich table. One row per P4 port (or per FPGA,
when multiple FPGAs share a port), with columns for the FPGA serial,
host, personality, route lanes (bidirectional arrows ▾/▴), port up/down
flag, and Rx/Tx throughput in Gbps.
It accepts the snapshot from either stdin (piped from
psi_gather.py) or a file argument. A --watch N mode re-invokes
psi_gather.py every N seconds and redraws in place.
# Piped — gather and display in one go.
poetry run python scripts/psi_gather.py | poetry run python scripts/psi_display.py

# From a saved snapshot.
poetry run python scripts/psi_display.py snap.json

# Live mode — re-gather every 30 s.
poetry run python scripts/psi_display.py --watch 30

# Show all 32 P4 ports (default hides empty rows).
poetry run python scripts/psi_display.py -a snap.json
Example output:
Notes
Tango on Low PSI is reachable only from inside the K8s cluster.
psi_gather.pyqueries theconnector-default-0pod viakubectl execrather than connecting to Tango directly.The display does not poll Tango itself; refresh latency is governed by
psi_gather.pyand the--watchinterval.