Overview
The data product dashboard lists, searches, and enables download of data products saved on a shared data volume. This documentation guides you through the dashboard’s features for finding data products and viewing their metadata.
On the DP Platform, an example dashboard is accessible at this address. To set up the dashboard locally, see the Developer Guide.
Usage
The dashboard displays a table of data products from the shared data volume. If a view of the data_item PostgreSQL table used by the DLM (Data Life Cycle Manager) has been shared with the dashboard database user, metadata for DLM-registered products is also shown.
Example Data Product Dashboard
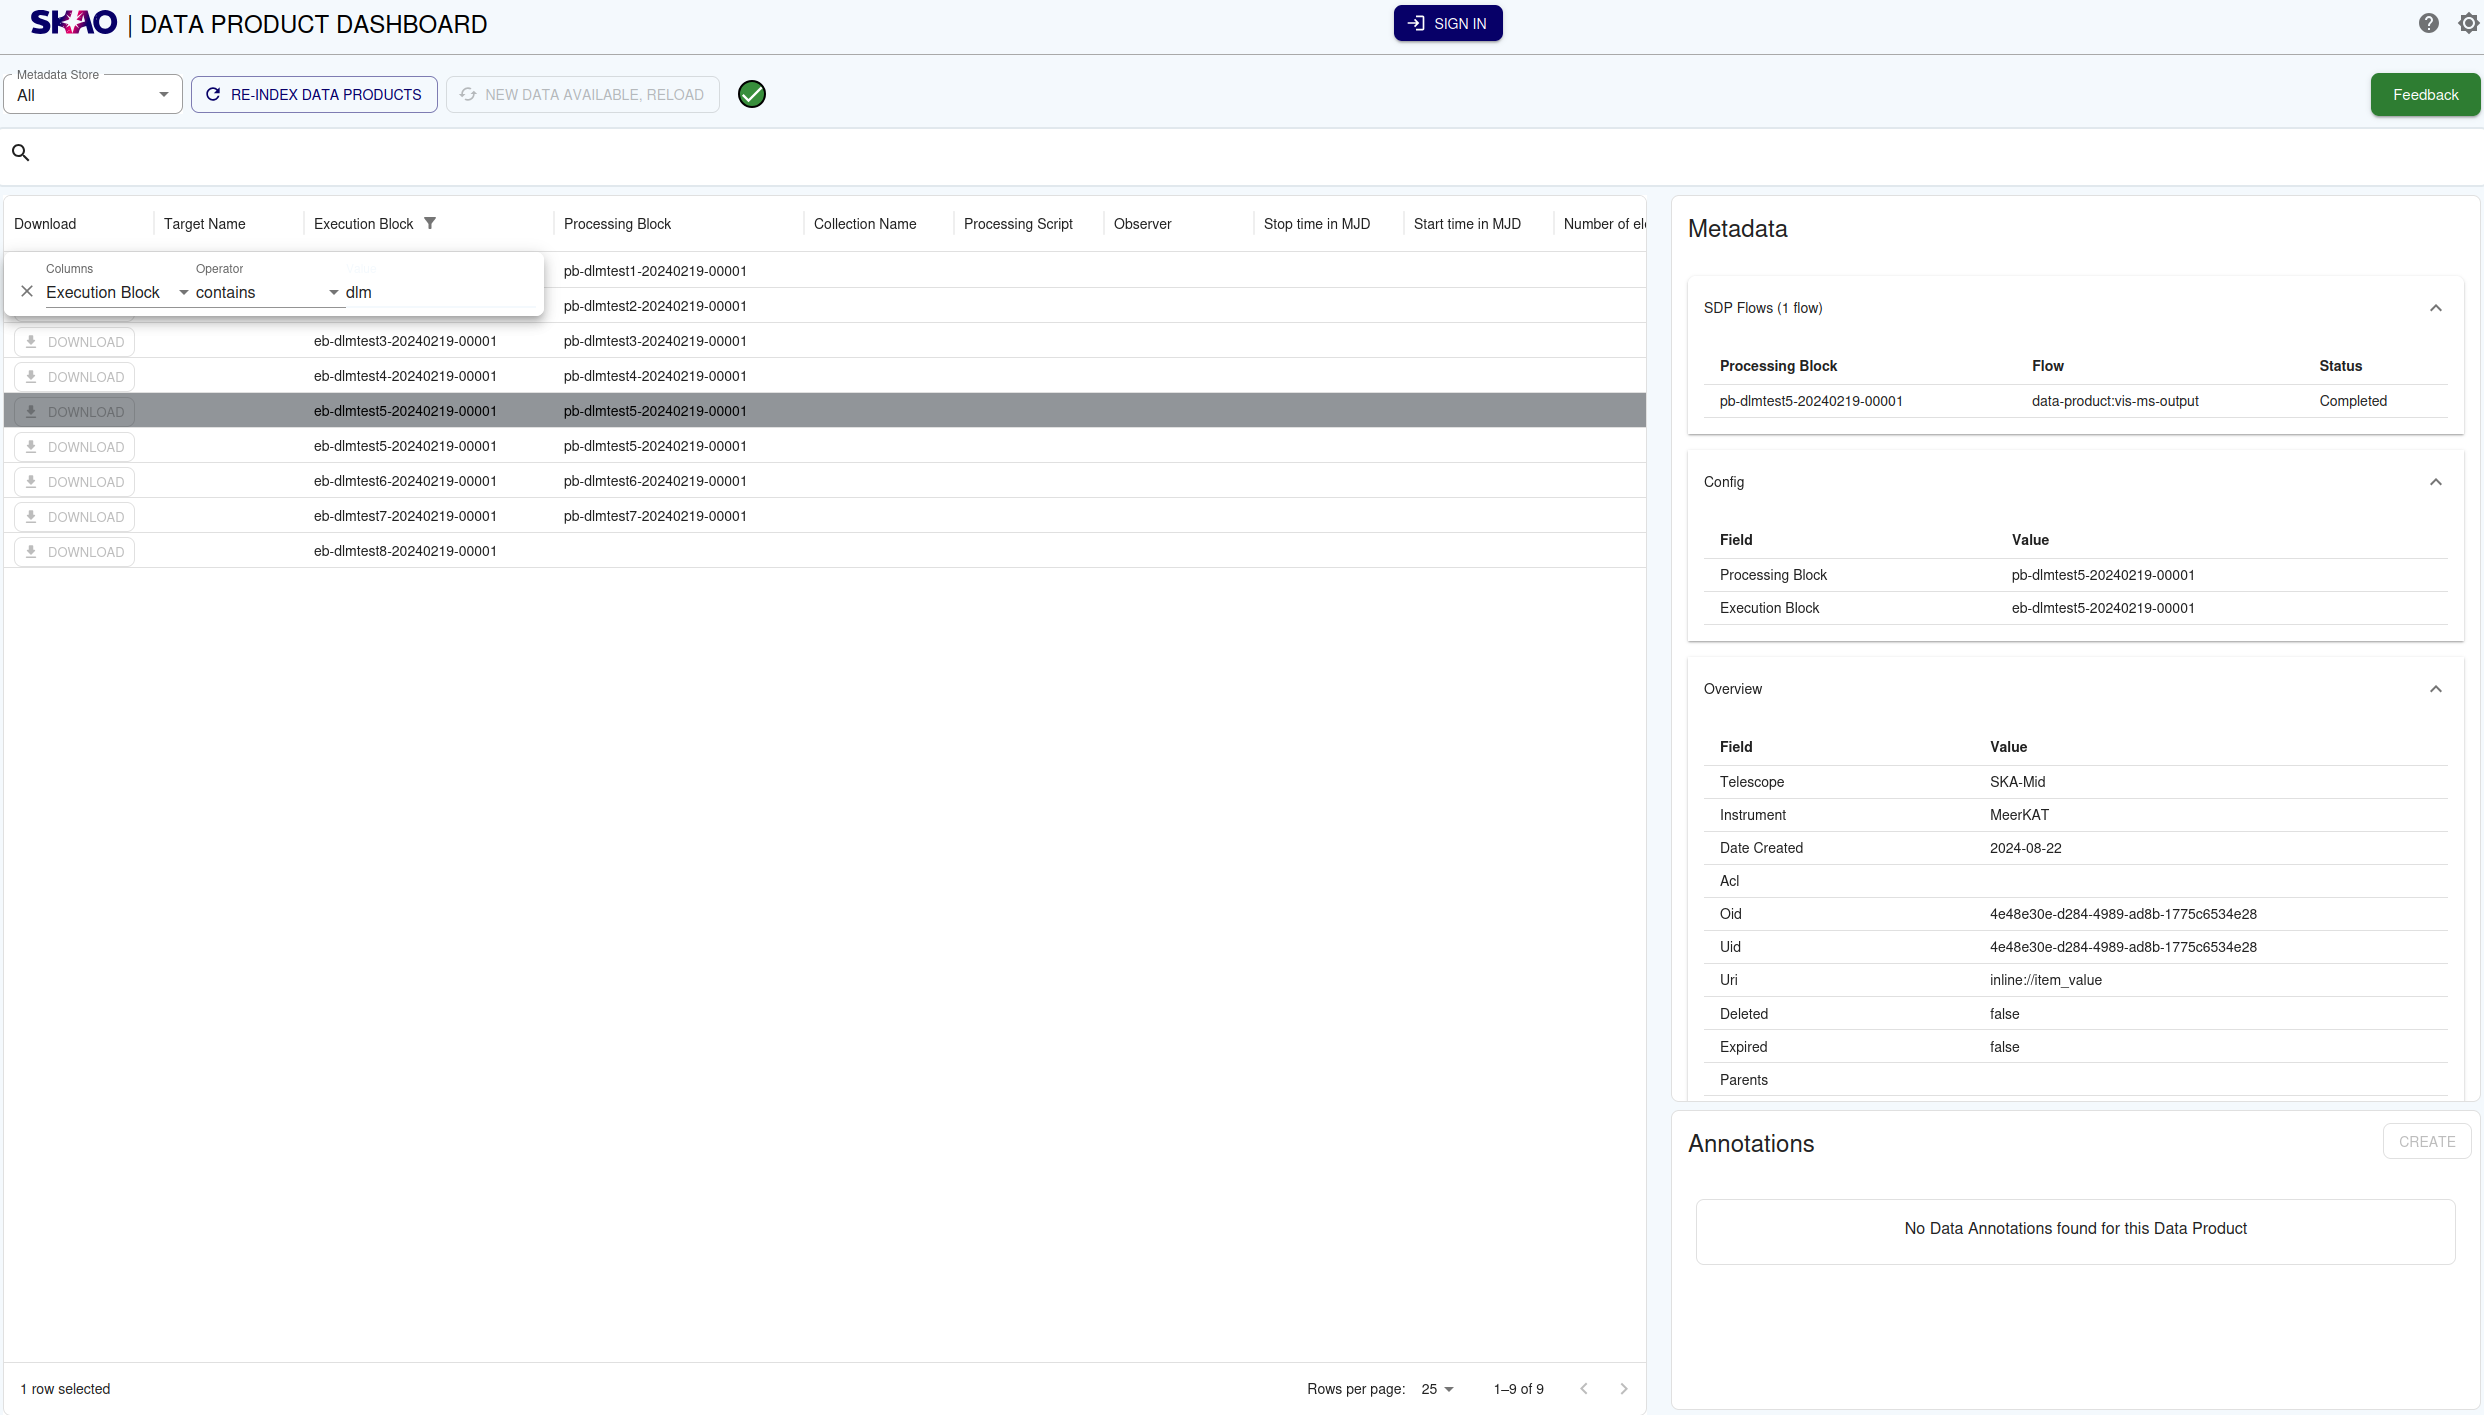
This table has built-in functionality for sorting and filtering, allowing a user to select any column header, and filter for values contained in that property of the products.
The user can access the search options by clicking on the search box above the table. Various key value pairs can be selected as search parameters. Among these parameters the user can give a date range. If multiple search parameters are combined they are considered a logical and.
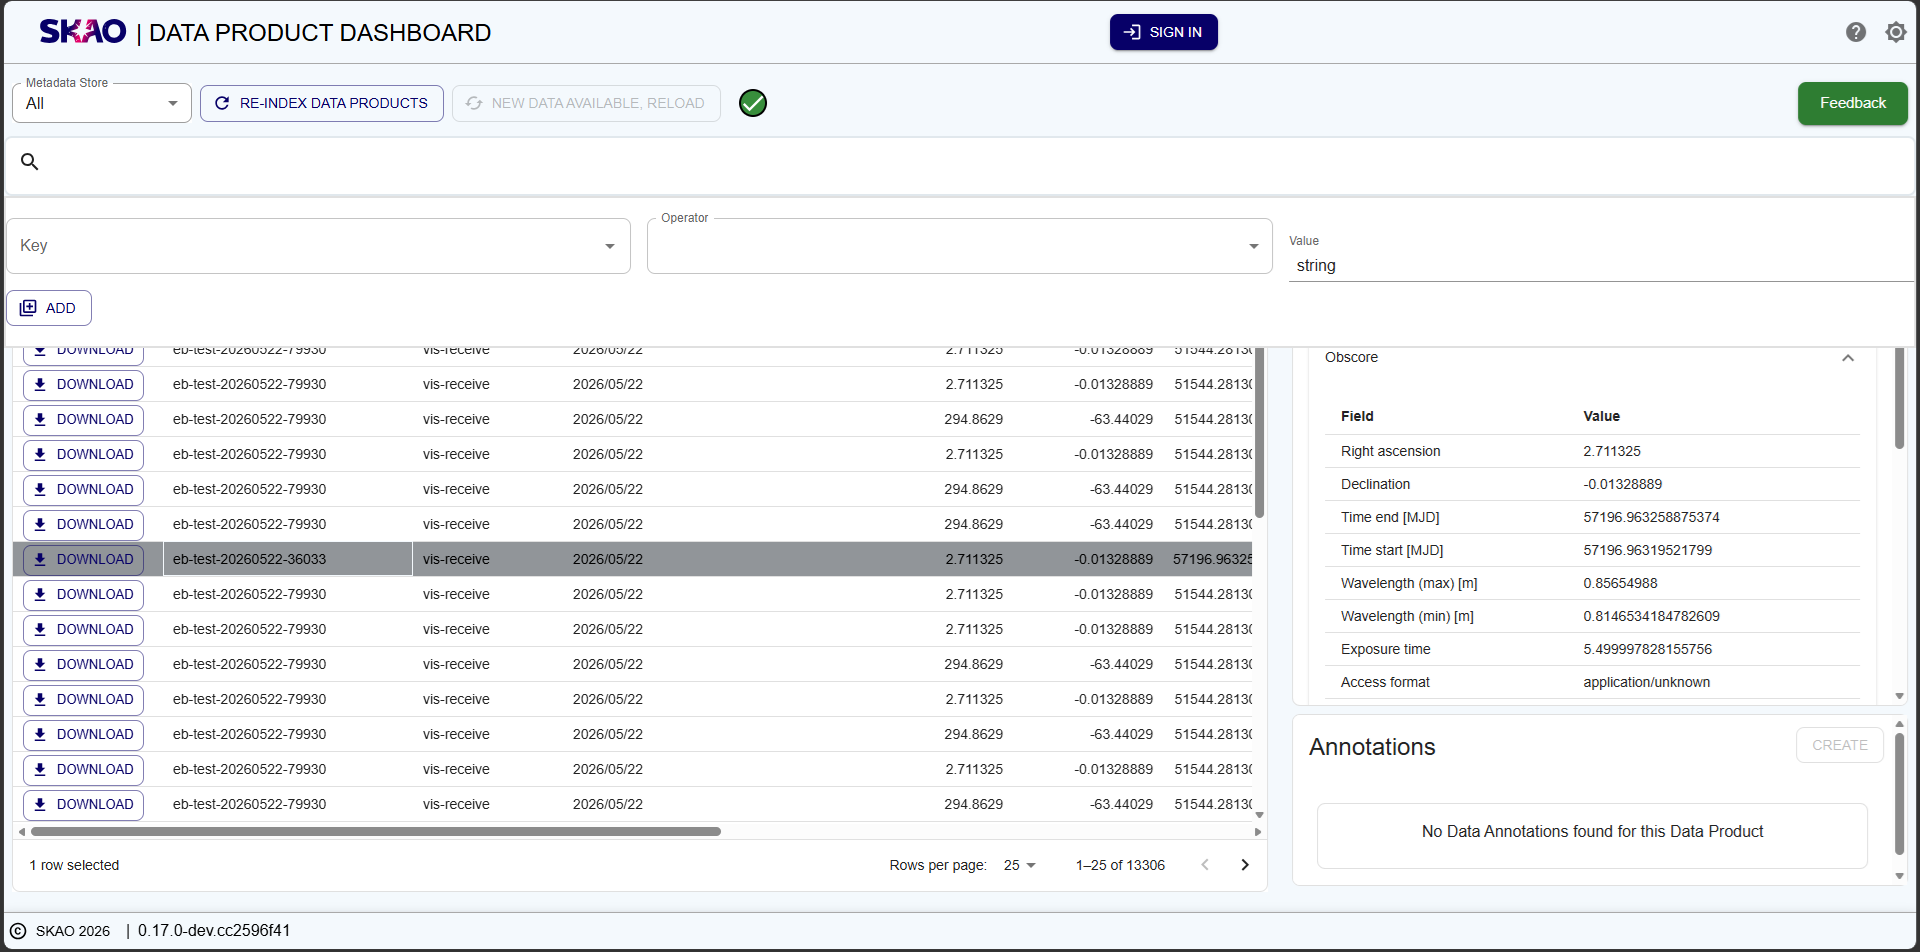
Example Data Product Dashboard search with time range and key value pair.
On initial load the table presents only default columns. Additional columns can be selected or selected columns deselected. This can be done by selecting or deselecting columns in the Manage Columns modal.
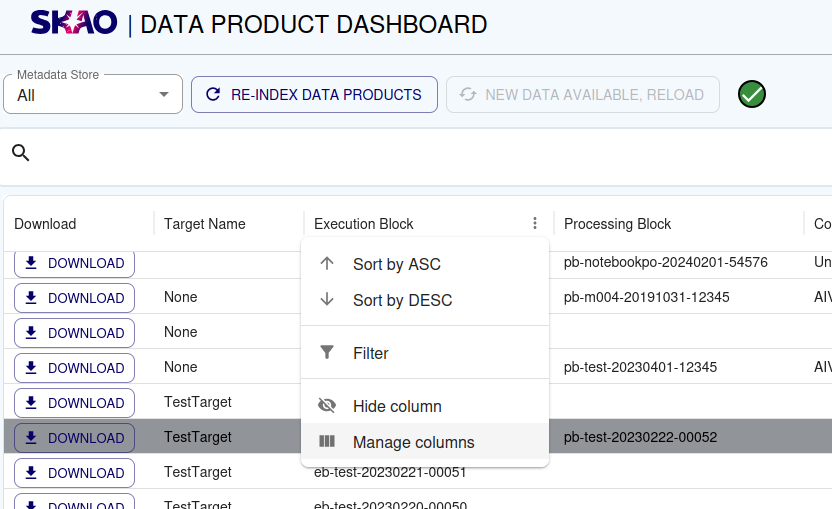
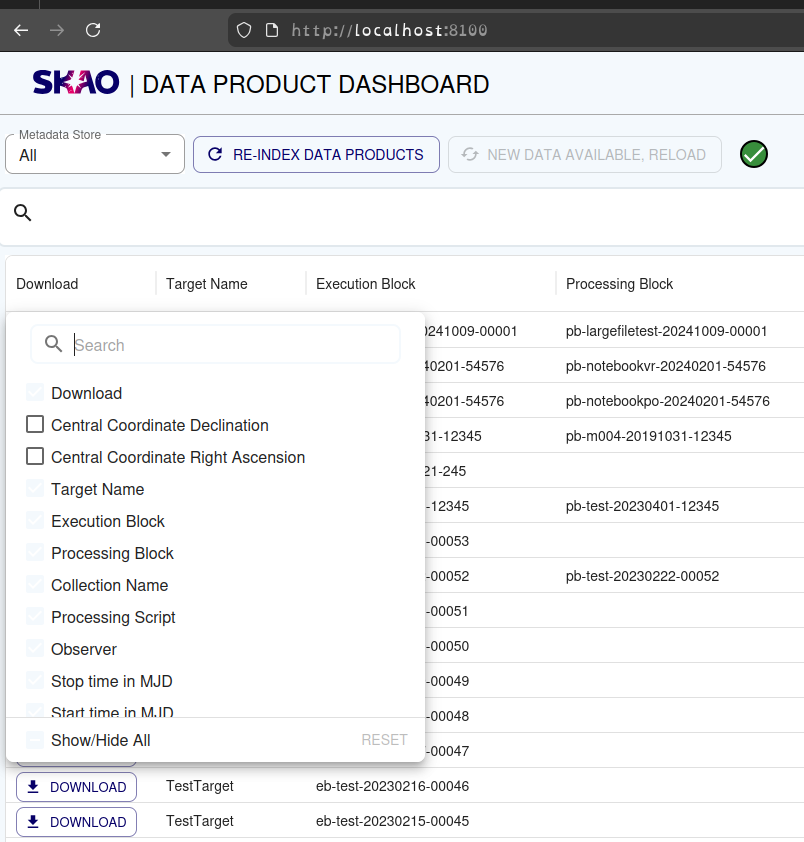
Once the selection has been made, this selection is set as a new default. On subsequent loads this default is presented in this browser.
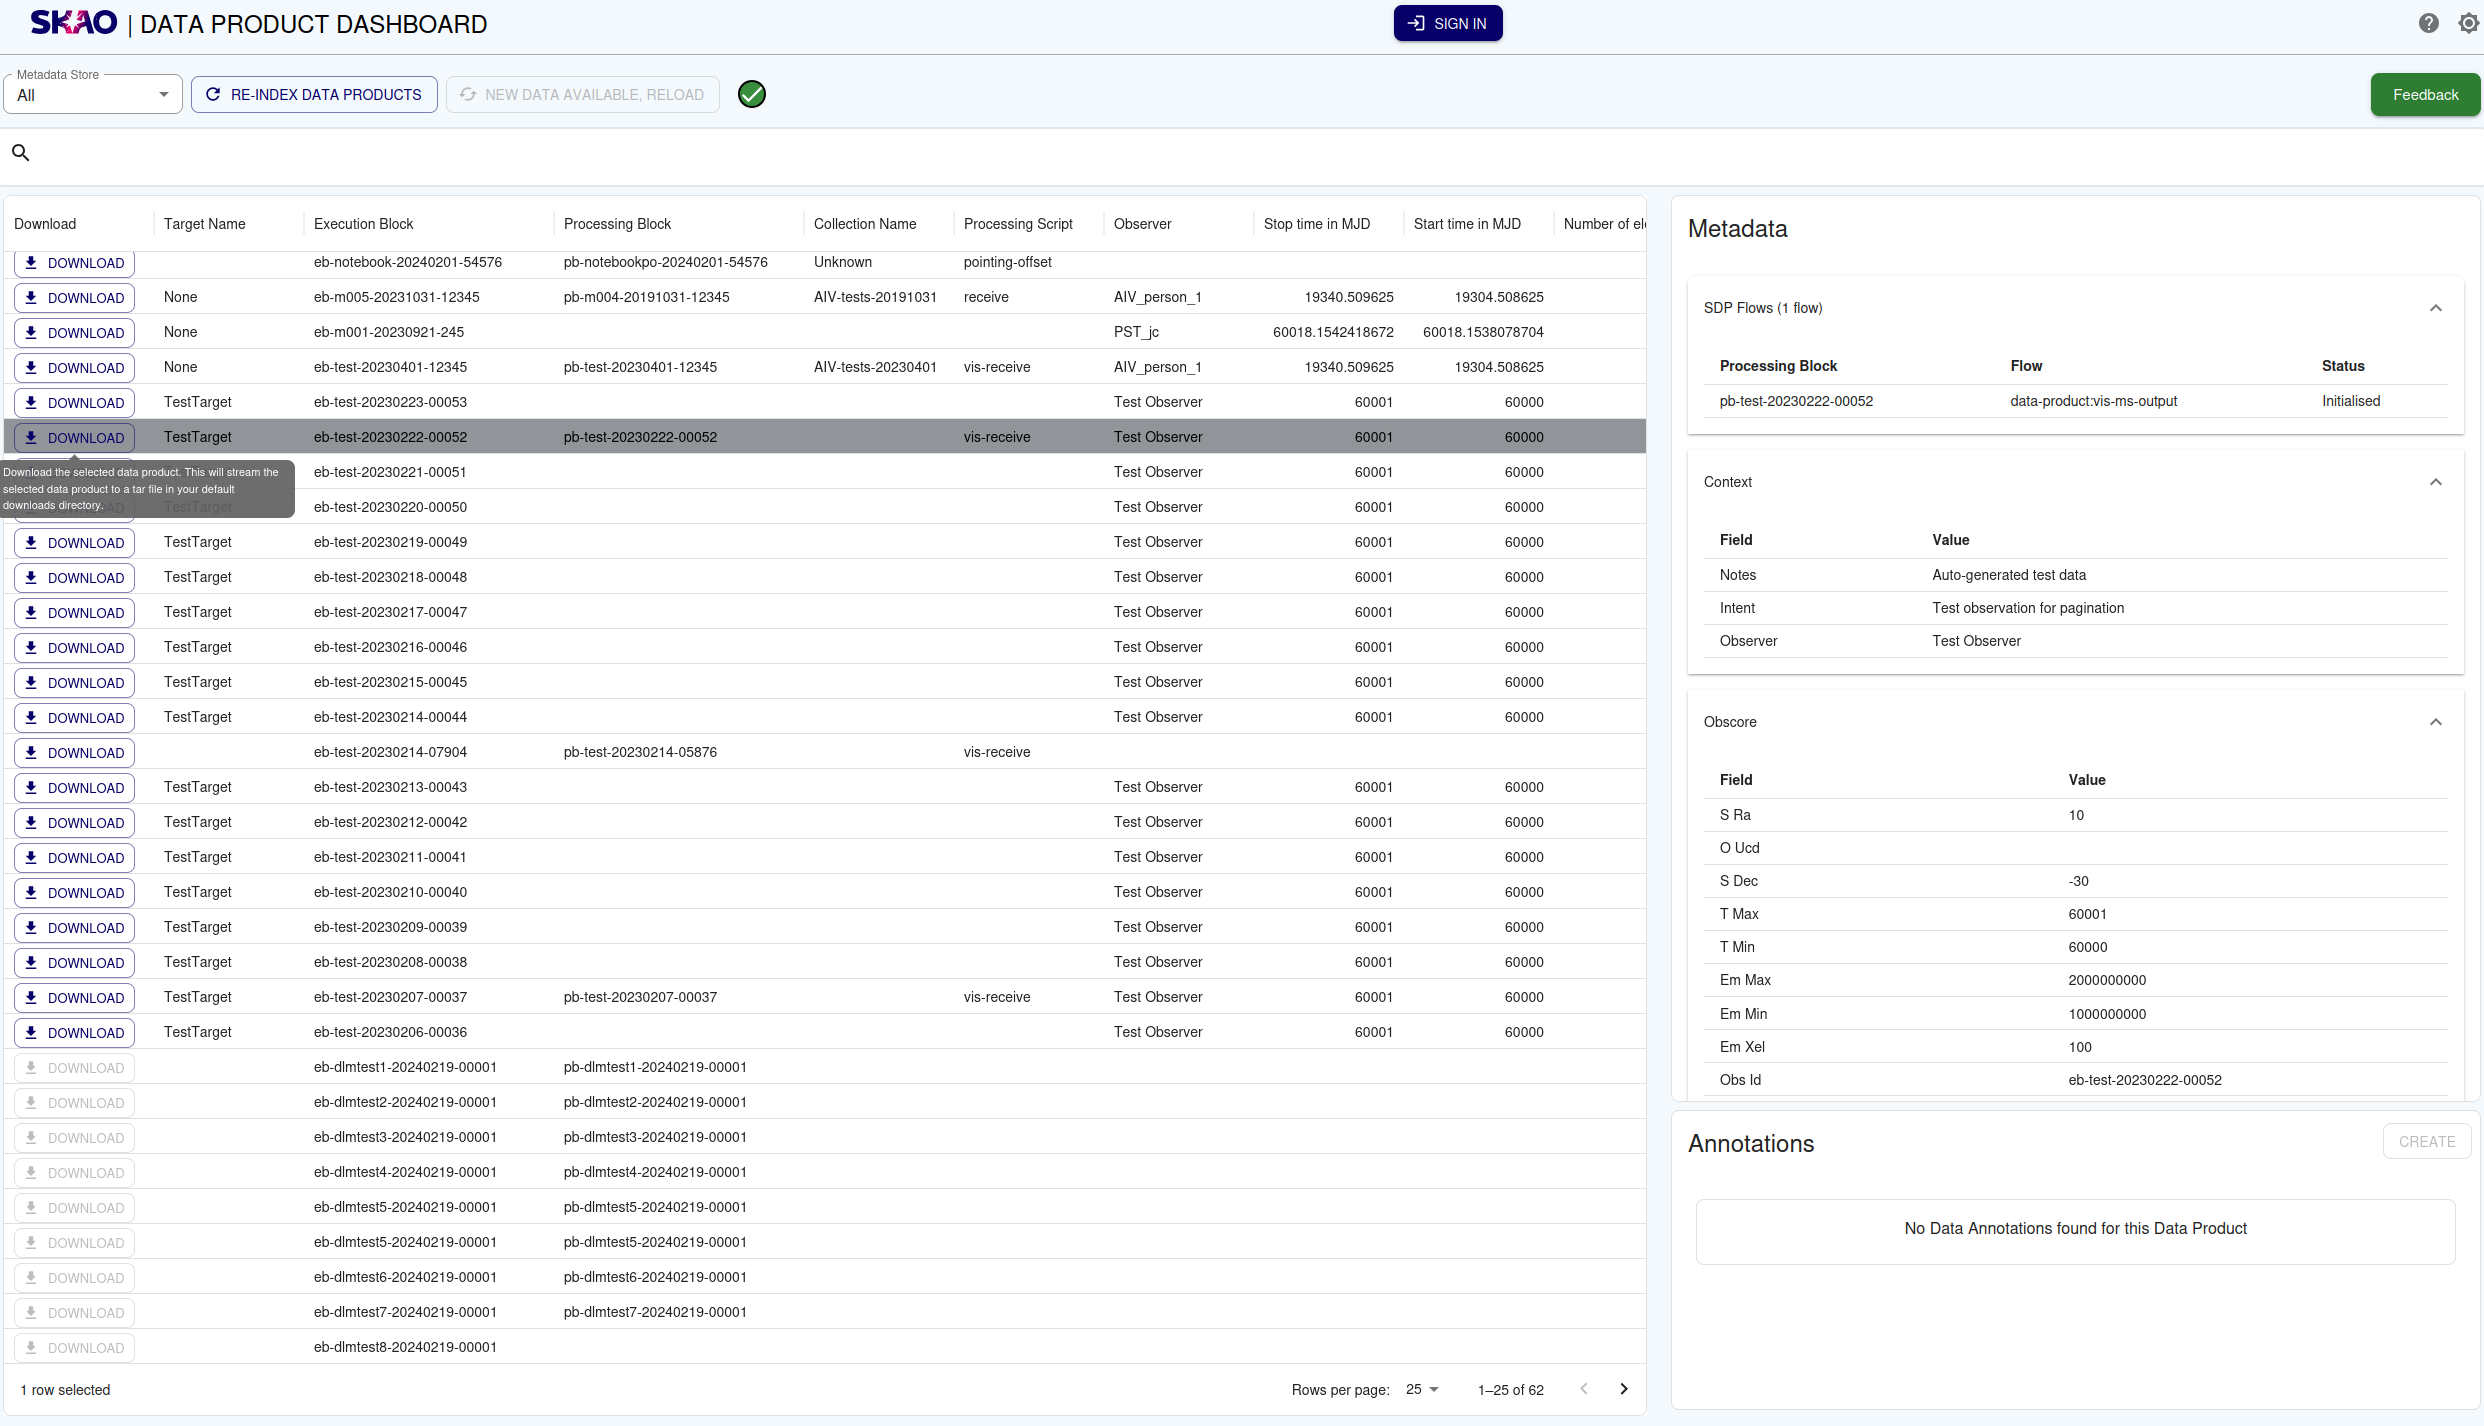
The metadata panel is always visible on the right side of the table. When no data product is selected, it displays a prompt to select one. When a data product is selected, its metadata is displayed in expandable/collapsible sections grouped by category (context, obscore, config and files).
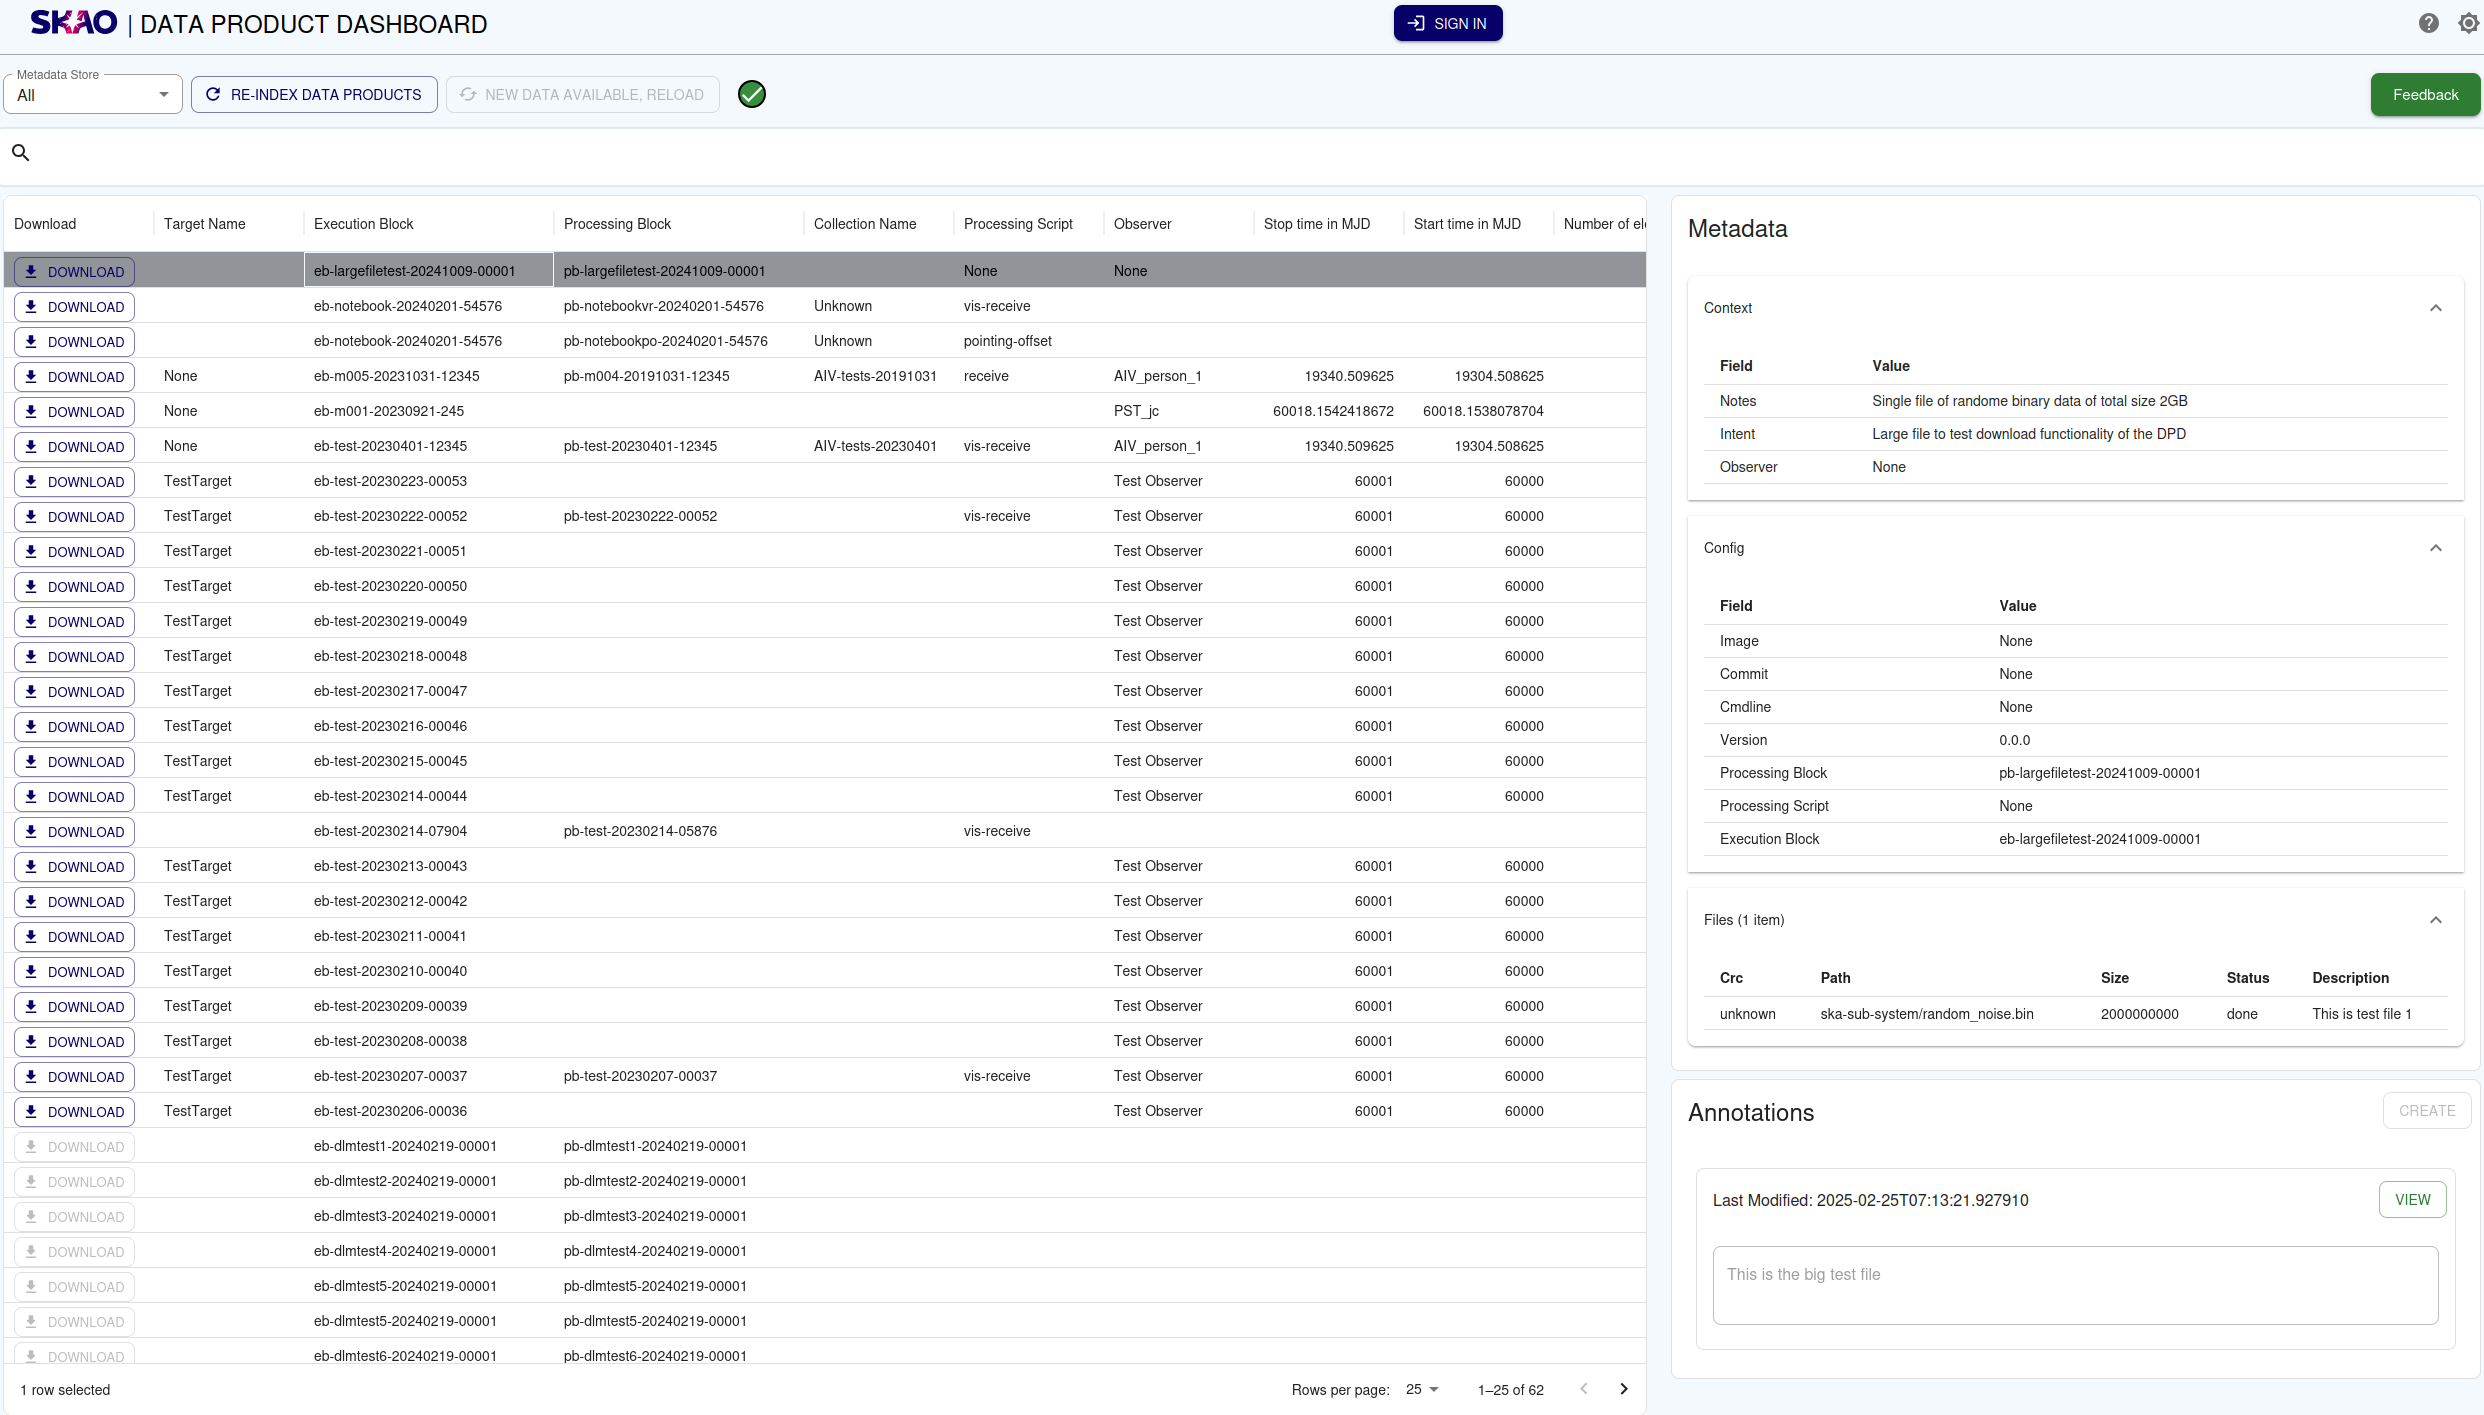
Example of selected data product metadata with collapsible sections.
The download functionality for these items will depend if the product is accessible on the shared data volume. If available the user will be able to stream the data product to disk as a .tar archive with the browser download manager.
Example of file downloaded with browser download manager.
The data annotations associated with the selected data product can be viewed on a panel on the right of the table under the metadata.

Example of data annotations panel.
Pre-populating Form Entries
It is possible to create links that will pre-populate the search form.
Example links:
https://<url>/?start_date=2026-01-01&end_date=2026-03-31- will search for all Data Products between2026-01-01and2026-03-31https://<url>/?execution_block=<eb-id>- will search for any execution block with that<eb-id>string in it.
It is possible to combine any search term like this, but note that all search
terms will be combined. The combined search is computed as a logical and.
So using dates and an execution block ID will cause the
search to look for any execution block with that ID that is within that date
criteria. Any Key from the form can be used in the URL.
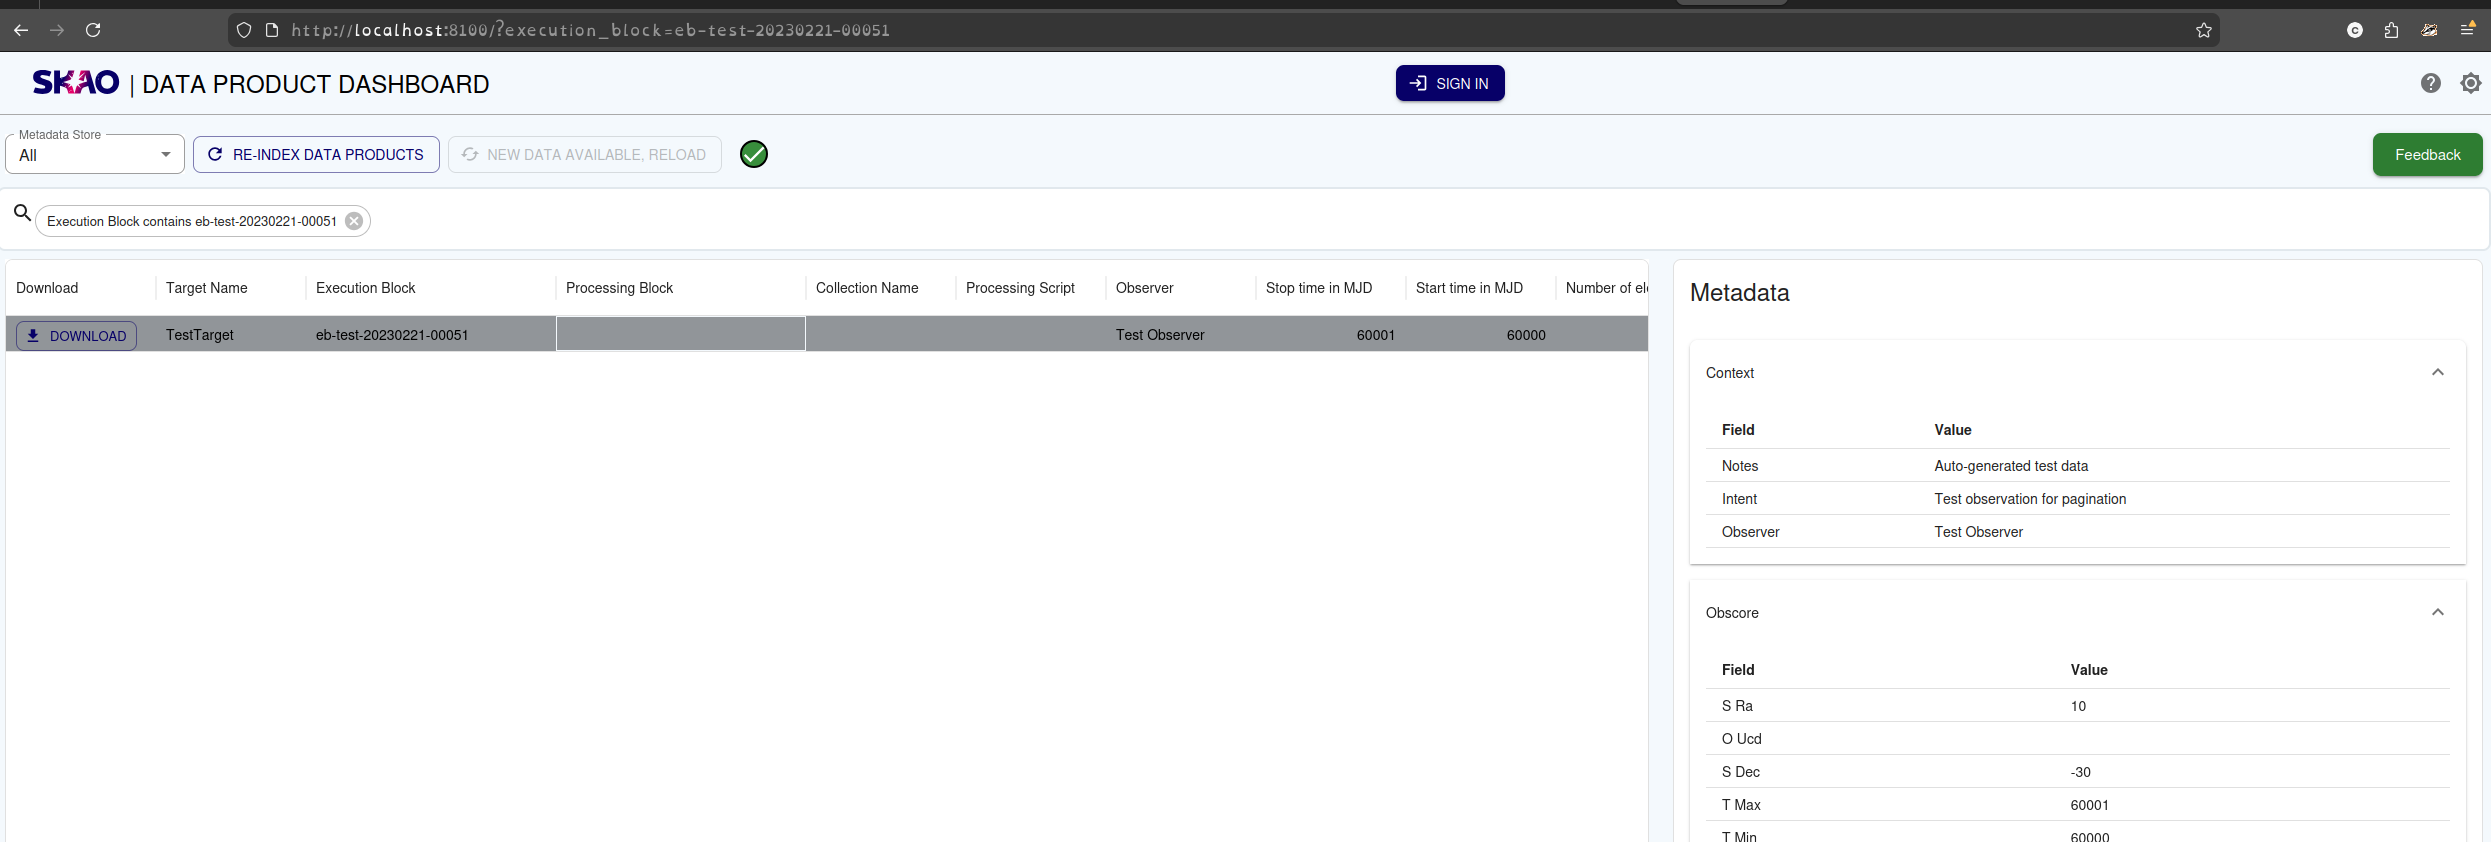
Example of pre-populating the form from the URL.
Data Product Index
The dashboard can be deployed with either a persistent metadata store using a PostgreSQL backend, or an in-memory solution that indexes all the data products on the shared data volume and creates a table in memory.
PostgreSQL backend
When the PostgreSQL backend is in use, each Persistent Volume is assigned a stable identity (a UUID stored in a small file at the PV root). All metadata table names in PostgreSQL are derived from this UUID, so:
The same PV always maps to the same tables — metadata is preserved across pod restarts and kept current via upserts.
Different PVs use different table names, so multiple independent volumes can share a single PostgreSQL instance without conflict.
In horizontally-scaled deployments (multiple API pods), only one pod per volume performs the PV scan at any time. A shared coordination table (dpd_indexing_state) manages this automatically: the first pod to start claims a leadership slot for its volume and begins indexing; other pods detect the active leader and serve data from the shared tables immediately. If the leader crashes, the slot is reclaimed after a 5-minute heartbeat timeout.
In-memory backend
When no PostgreSQL instance is available, the API indexes the data volume into memory on startup. Data is not persisted across restarts.
When products are directly loaded onto the shared volume, the user can re-index the data volume to update the metadata store of the Data Product Dashboard accordingly.
The dashboard will automatically reload after a re-index or when new data is added to its store via the rest API endpoints. The reload button will be deactivated while the dashboard is in sync with the data in the store.
API Status Indicator
The dashboard displays a status icon that provides real-time information about the backend API connection and indexing status. Hovering over the icon displays a tooltip with detailed status information, including:
Current indexing state
Metadata and search store state
API availability and connection status
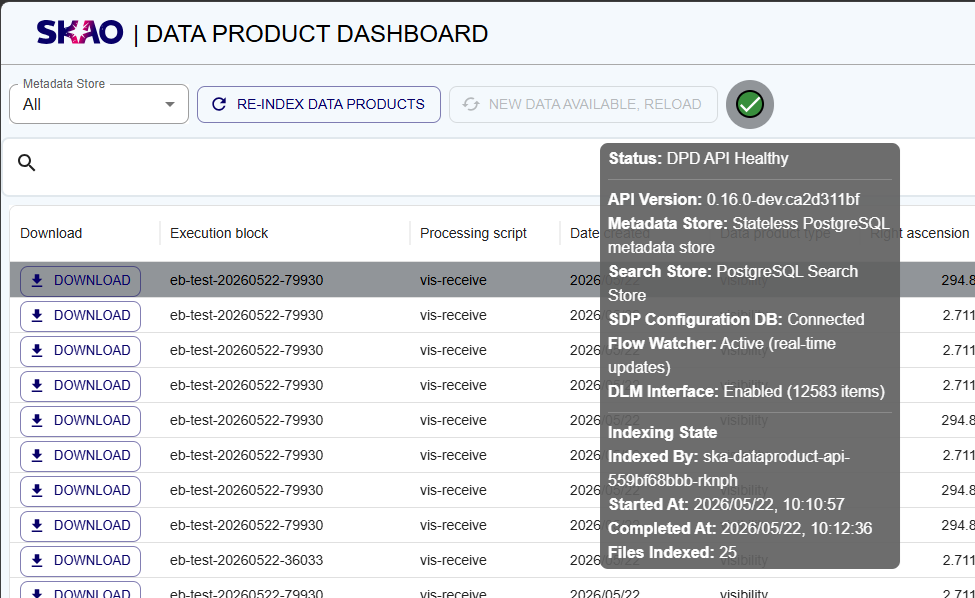
Example of API status indicator with tooltip information.
Connecting to an SDP Configuration Database
The dashboard can connect to a Science Data Processor (SDP) Configuration Database (Config DB) to retrieve data flow information. Data flow objects indicate the status of a data product — for example, whether it is already available or still being written. The dashboard displays flow keys and status alongside data products in the table.