Centralised Monitoring and Logging
A centralised monitoring and logging solution was designed to eliminate the need for having many dashboards and services to access monitoring while enabling the aggregation of data from different datacentres, centralising monitoring dashboards and alerting and secure communication with monitoring systems with zero trust principles. Both the STFC and DP datacentres have been fully integrated into this solution.
On the one hand, the central monitoring solution is based on Prometheus, integrated with Thanos, providing high-availability and long-term storage capabilities while allowing for the data aggregation from multiple Prometheus targets. Oh the other hand, the central logging solution is based on Filebeat, collecting logs from the referred datacentres and shipping them to Elasticsearch.
Grafana and Kibana are the chosen observability and data visualisation tools, respectively.
Services access and guidelines
Depending on what is to be monitored and the datacentre to which it belongs, there are several services that can be used. The following sections highlight the purpose of each service available as well as the URLs and underlying conditions to access them.
Grafana
To monitor SKA Infrastructure related metrics from, for example, Kubernetes, Gitlab Runners, Elasticstack or Ceph, Grafana dashboards should be used.
The URL to access it is: https://k8s.stfc.skao.int/grafana/
To log in choose the “Sign in with Microsoft” option and use the <jira-username>@ad.skatelescope.org and <jira-password> combination.
Once logged in a user can browse through the existing dashboards and monitor the desired metrics.
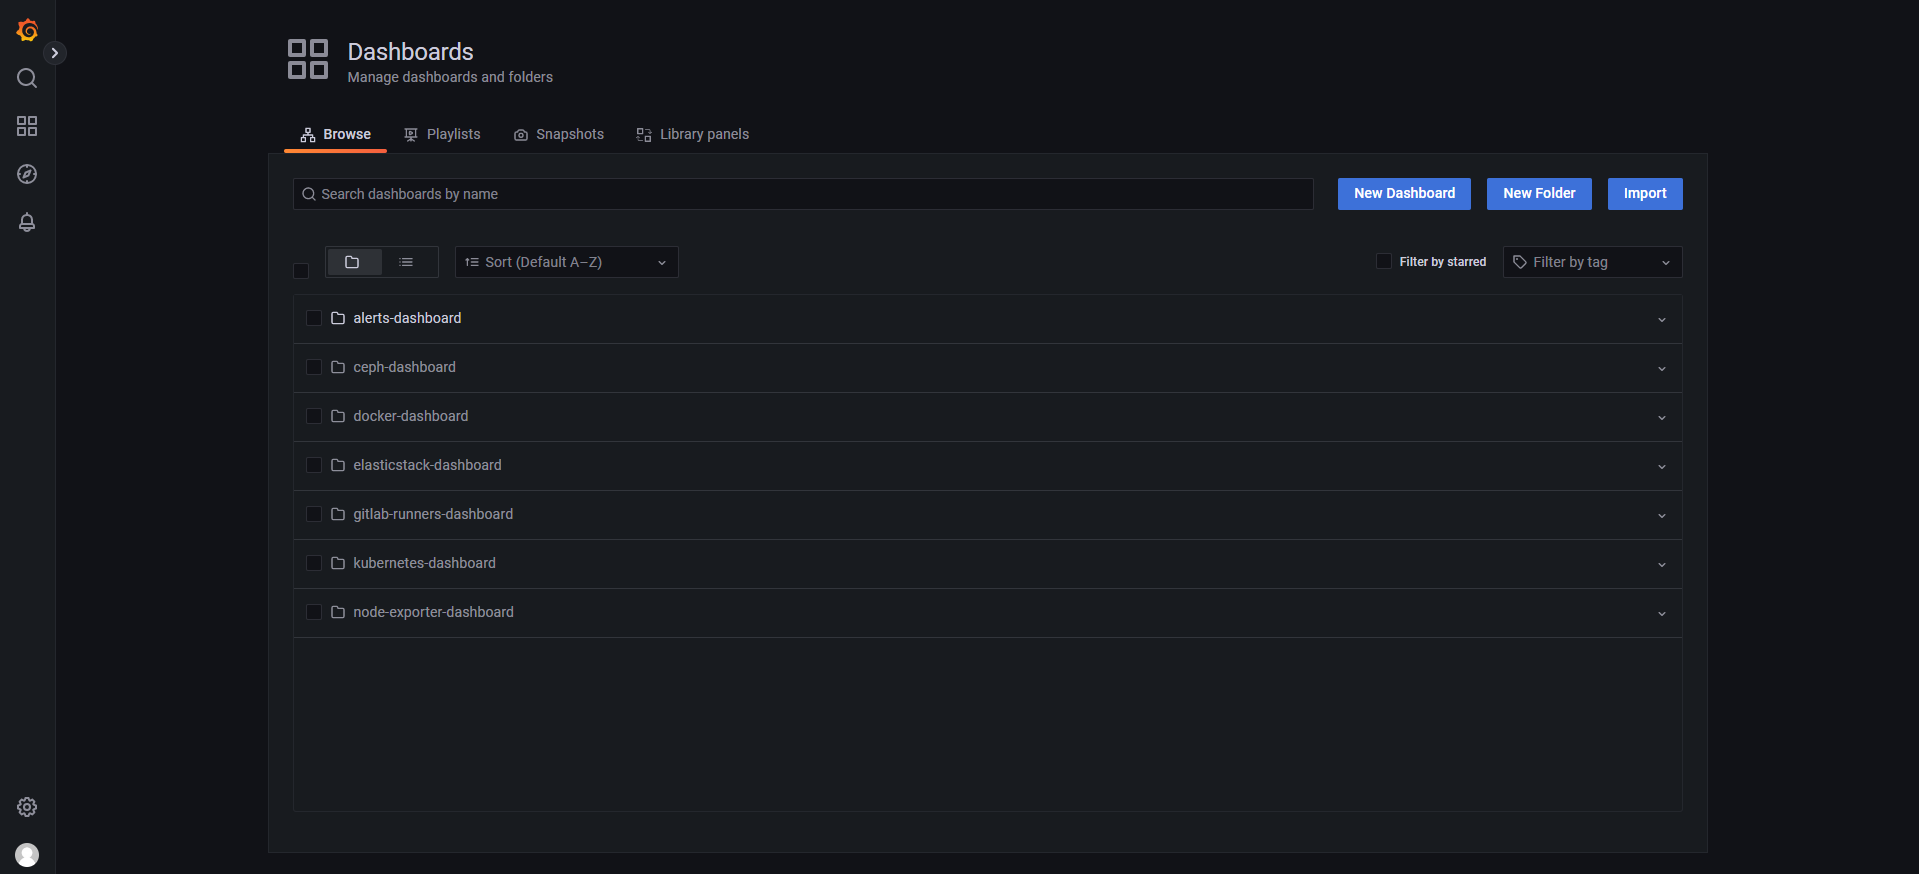
STFC Dashboards Browsing page
Besides taking advantage of the already existing dashboards, users can also create their own dashboards and share them, as shown below, displaying the information that they require.
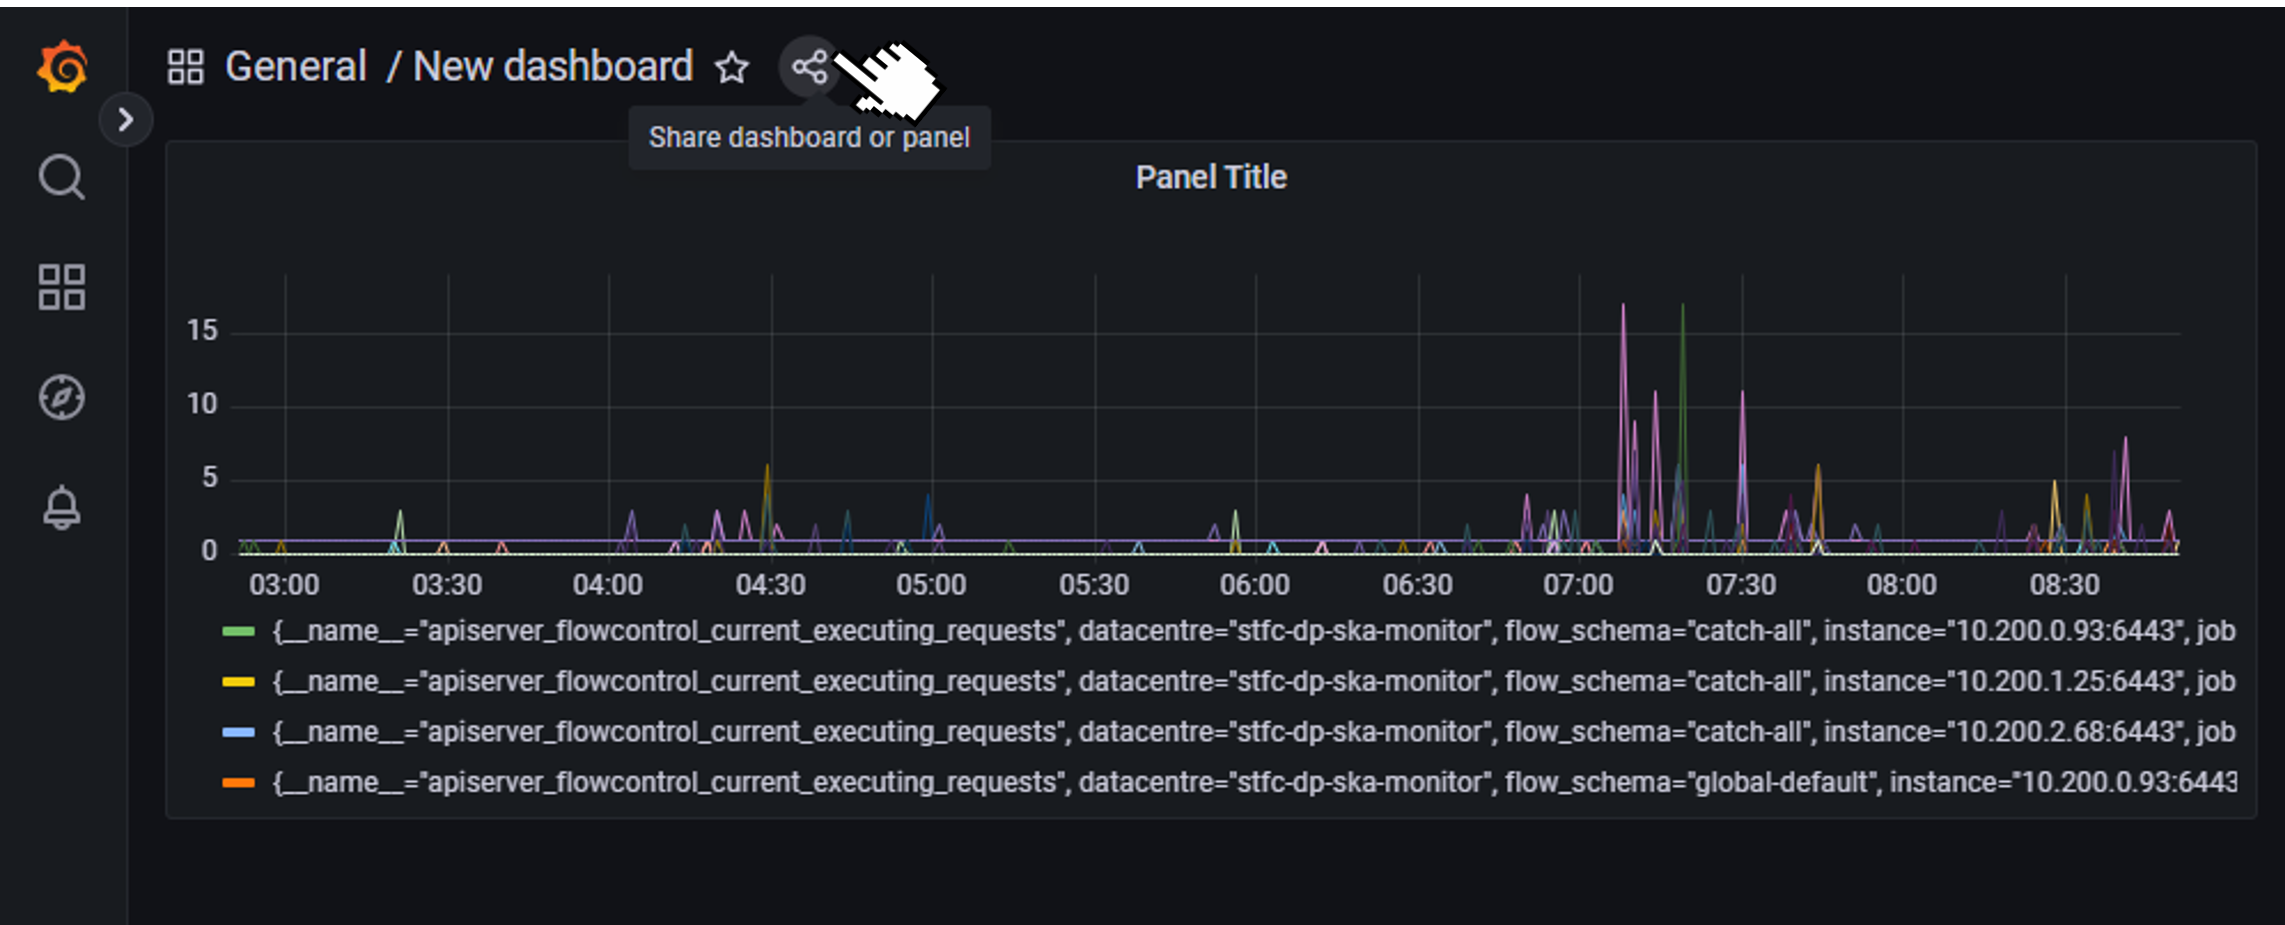
New Dashboard Sharing example
Kibana
To check the logs collected by Filebeats from a single or multiple clusters, Kibana should be used.
The URL to access it is: https://k8s.stfc.skao.int/kibana/app/logs/stream being that the user should log in as described in the Grafana section and, then, choose the option “Continue as Guest”.
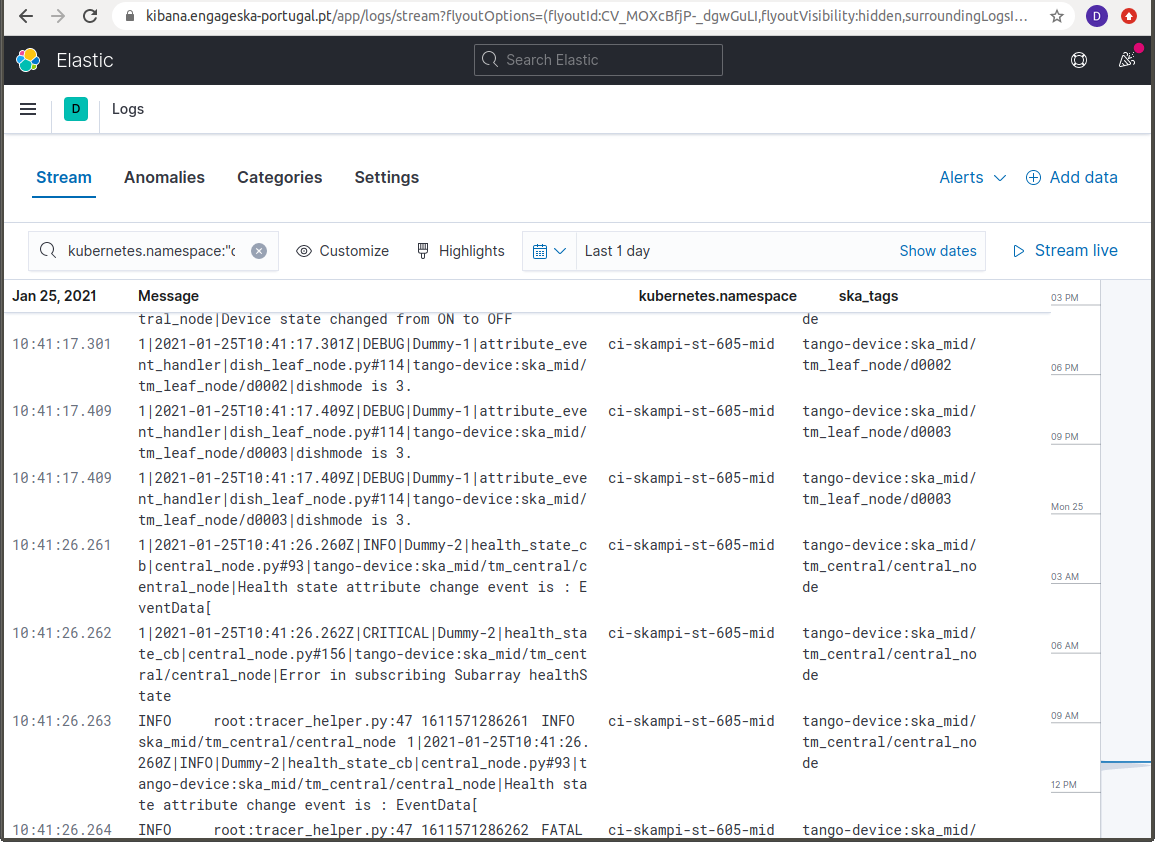
Kibana allows for filtering of log messages on the basis of a series of fields. These fields can be added as columns to display information, using the Settings option, and filtering by the values of those fields can be done directly on the Search box or by selecting the View details menu:
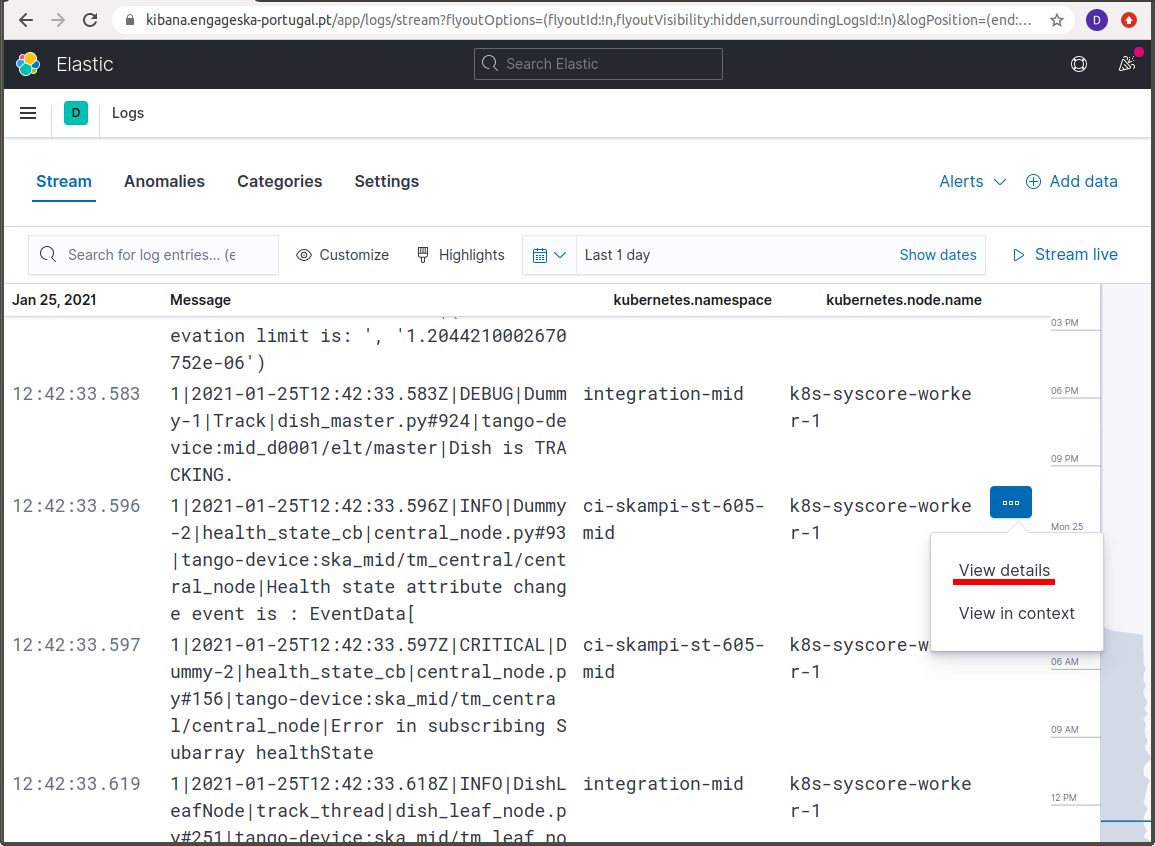
In the example above in order to retrieve only the log messages relevant for the skampi development pipeline ci-skampi-st-605-mid, one should then select the corresponding kubernetes.namespace field value.
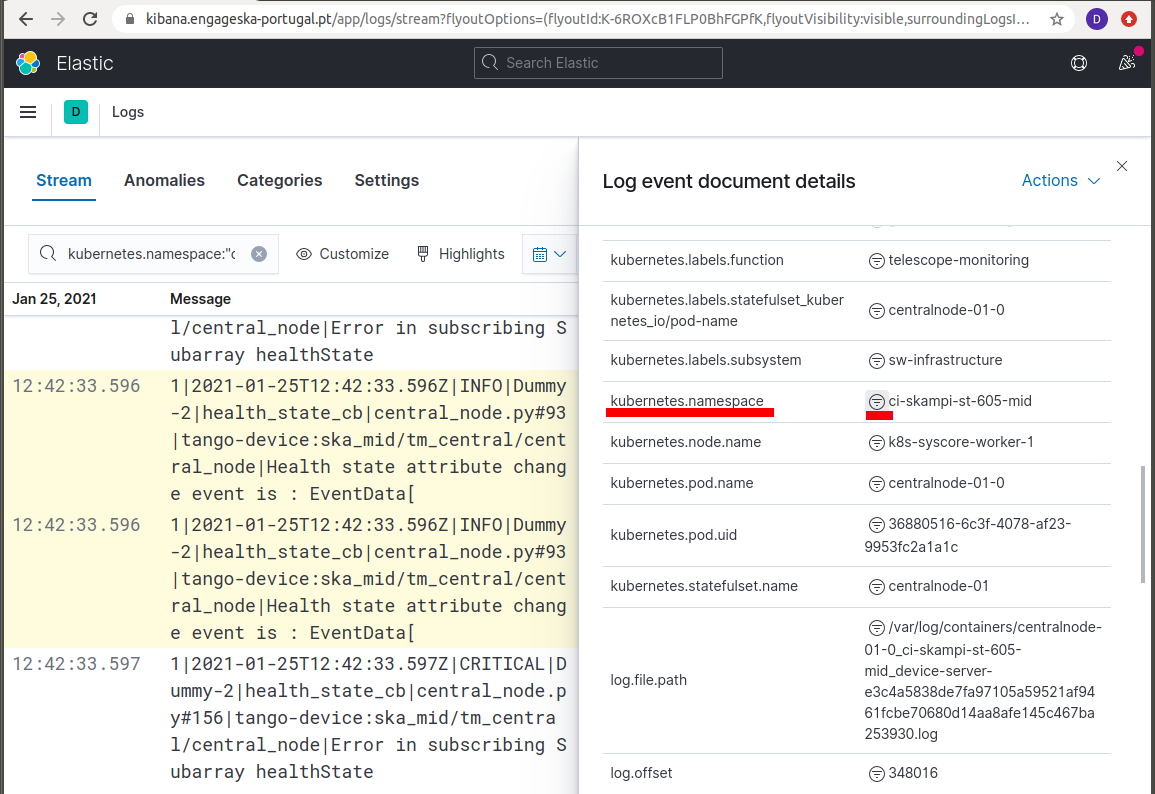
There are many other field options using kubernetes information, for example kubernetes.node.name and kubernetes.pod.name, that can be used for efficient filtering.
The fact the SKA logging format allows for simple key-value pairs (SKA Tags) to be included in log messages let us refine the filtering. Tags are parsed to a field named ska_tags and on this field there can be one or more device properties separated by commas.
The field ska_tags is also parsed so that the key is added to a ska_tags_field prefix that will store the value. For the example above, this means filtering the messages using the value of the ska_tags_field.tango-device field.
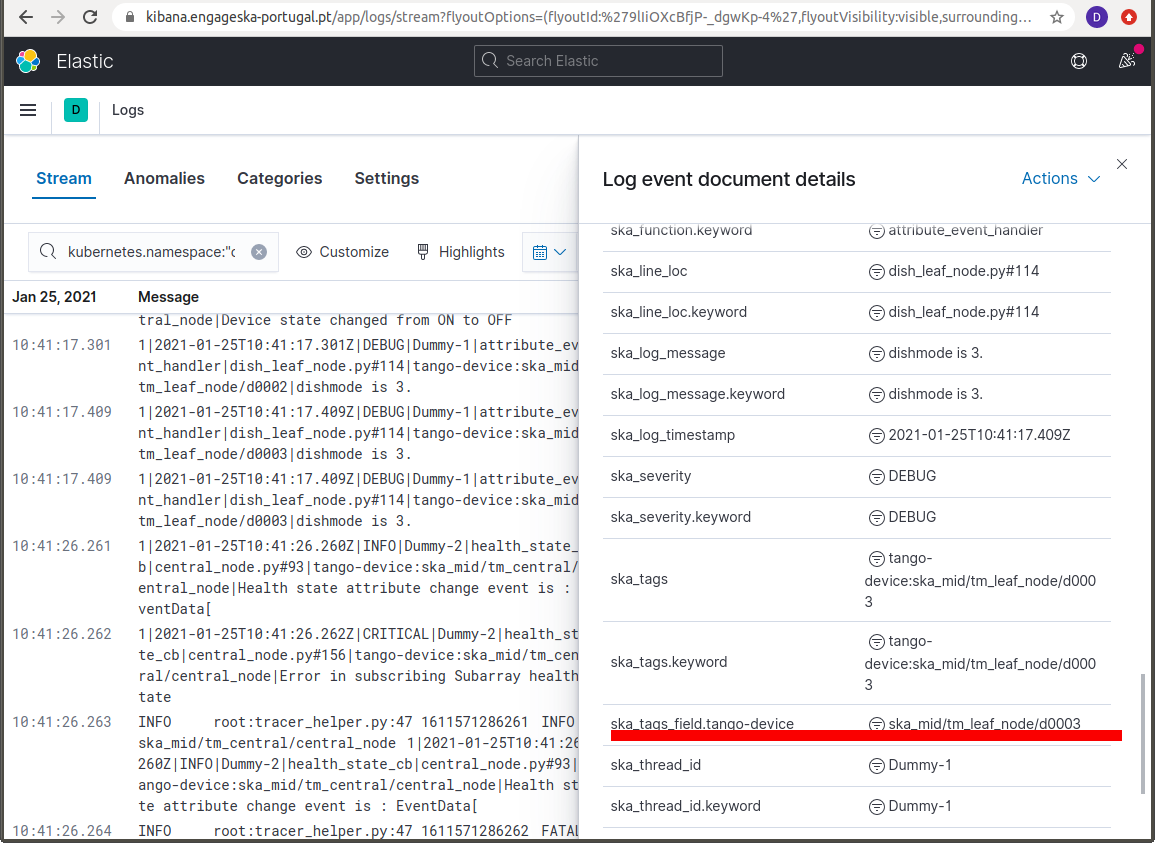
Making the selection illustrated above means that only messages with the value ska_mid/tm_leaf_node/d0003 for the ska_tags_field.tango-device field would be displayed.
Prometheus Alerts
To check the prometheus alerts, generated for the core kubernetes cluster and the infrastructure VMs, a user can choose between the web access to the Prometheus Alert Manager UI and the Slack alerts channels.
The URLs to access the Prometheus Alert Manager are:
STFC datacentre - http://monitoring.skao.stfc:9093/#/alerts
DP datacentre - http://monitoring.sdhp.skao:9093/#/alerts
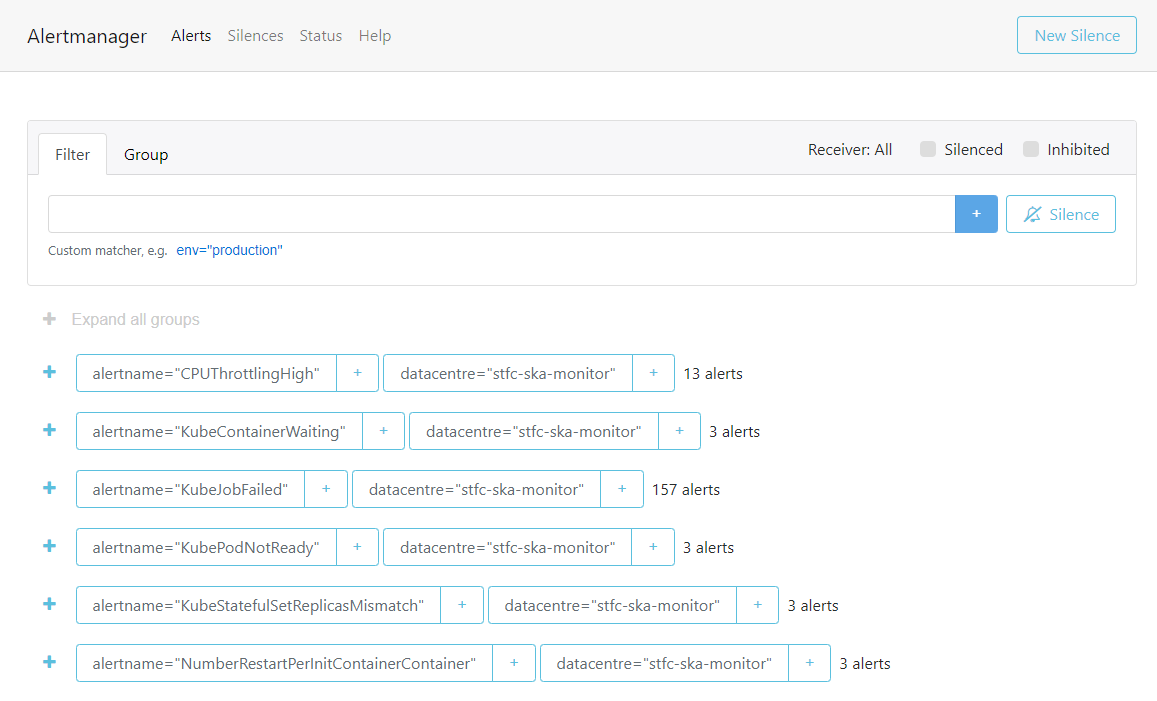
STFC Alert Manager homepage
It is important to note that these URLs are behind a VPN, so VPN access to the corresponding datacentre is required to access them.
There are also two sets of Slack alerts channels, one that serves application alerts and another that serves developer related alerts. These are:
- STFC datacentre
Application alerts - #techops-alerts
Developer alerts - #techops-user-alerts
- DP datacentre
Application alerts - #dp-platform-alerts
Developer alerts - #dp-platform-user-alerts